4.7 Horizontal Alignment
It is necessary to establish the proper relation between design speed and curvature when designing roadway alignment. The two basic elements of horizontal curves are:
- Curve radius; and
- Superelevation rate.
4.7.1 General Considerations
There are several general considerations important for safe, smooth flowing, and aesthetically pleasing facilities. These practices, as outlined below, are particularly applicable to
high-speed facilities.
- Flatter than minimum curvature for any particular design speed should be used where possible, while retaining the minimum guidelines for the most critical conditions.
- Alignment consistency should be sought. Sharp curves should not follow long tangents or a series of flat curves.
- Sharp curves should be avoided on long, high fills. It is difficult for drivers to perceive the extent of curvature and adjust their operation accordingly when the adjacent topography does not extend above the level of the roadway.
- Compound curves (two adjacent curves in the same direction with different radii) should be used with caution and should be avoided on mainlanes where conditions permit the use of simple curves. Where compound curves are used, the ratio of the flatter radius to the sharper radius should not exceed 3:2 (i.e., R1should not exceed 1.5R2). For intersections or other turning roadways (such as loops, connections, and ramps), this ratio may be increased to 2:1 (i.e., R1may be increased to 2R2).
- Reverse curves (two adjacent curves in opposite directions) on high-speed facilities should include a tangent section of sufficient length to provide adequate superelevation transition between the curves.
- Broken-back curves (two curves in the same direction with a short tangent between the curves) should be avoided except where very unusual topographical or ROW conditions make other alternatives impractical. This configuration is unexpected by drivers, not pleasing in appearance, and more difficult for freight truck maneuverability.It is recommended to provide a minimum tangent length that is at least 15 times the design speed.A design exception is not required if this recommended tangent length is not met.
- Horizontal alignment and its associated design speed should be consistent with other design features and topography. Combination of horizontal and vertical alignments is discussed in .
4.7.2 Curve Radius
The design of roadway curves should be based on an appropriate relationship between design speed and curvature as well as their joint relationships with superelevation rate and side friction. The minimum radii of curves are important control values in designing for safe operation. Design guidance for low-speed rural town, suburban, urban, and urban core facilities (45-mph and below) is shown in
. Design guidance for curvature of highspeed (50-mph and above) or rural context facilities is shown in
,
and
for maximum superelevation (e
max
) rates equal to 4 percent, 6 percent, and 8 percent respectively.For high-speed design conditions, the maximum allowable deflection angle without a horizontal curve is 30 minutes.
For low-speed design conditions, the maximum allowable deflection angle without a horizontal curve is 1 degree.
4.7.3 Superelevation Rate
As a vehicle traverses a horizontal curve, it undergoes a centripetal acceleration that acts toward the center of the curve. Vehicle weight, roadway superelevation, and side friction between the tires and pavement surface sustain this acceleration. The equation that governs vehicle operation on a horizontal curve is:
Where:
e =
superelevation rate, ft/ftf =
side friction factorV =
vehicle speed, mphR =
curve radius, ftThere are practical upper limits to the rate of superelevation.
The Department normally uses a maximum superelevation rate of 6 percent.
However, a maximum rate of 8 percent may be used where higher superelevation rates or sharper curves are desired. The recommended maximum for facilities where there is a regular occurrence of very-slow moving vehicles, whose operation might be affected by high superelevation rates is 6 percent.Use of 8 percent should be coordinated with the District Design Engineer prior to implementation and documented in the project files.
To provide designers flexibility in high-speed urban and suburban settings, a maximum superelevation rate of 4 percent may be used instead of a 6 percent or 8 percent superelevation rate.
Freeway facilities are excluded from using a maximum superelevation rate of 4 percent.
4.7.3.1 Methods of Calculating Superelevation Rate
When calculating superelevation on rural and high-speed suburban, urban, and urban core facilities, AASHTO uses a process known as
Method 5
. Method 5 is intended to accommodate overdriving that is likely to occur on flat to intermediate curves. Overdriving on such curves involves little risk that a driver will lose control of the vehicle because superelevation sustains nearly all the lateral acceleration at the average running speed and a large amount of side friction is available for greater speeds. Due to the additional side friction available, Method 5 is used on rural and high-speed suburban, urban, and urban core facilities to provide greater driver comfort and safety.Where superelevation will be applied to low-speed roads on low-speed rural town, suburban, urban, and urban core facilities, AASHTO uses
Method 2
superelevation distribution. Method 2 only introduces superelevation after the maximum side friction has been used. Therefore, no superelevation is needed on flatter curves. This method is used on low-speed rural town, suburban, urban, and urban core facilities where, because of various constraints, superelevation frequently cannot be provided. Method 2 ensures driver safety but does not offer the added driver comfort that Method 5 provides.- Urban contextincludes Urban Core, Urban, Suburban, and Rural Town.
- Rural contextis exclusive of urbanized contexts;
- Intermediate Speedis a range of speeds from 50 – 60 mph that technically falls within what would typically be categorized as a High-speed facility, the Intermediate values are provided in to give the designer additional flexibility in these transitional areas;
- The general continuum for the amount of calculated side force on a vehicle in a horizontal curve from greatest to least is as follows:
- Method 2;
- Method 5 (4 percent emax);
- Method 5 (6 percent emax); and
- Method 5 (8 percent emax).
The designer has the option of selecting a superelevation methodology that either increases the radius and/or decreases the side force for driver comfort on the various facility types listed ; and - Side force should never exceed AASHTO maximums for a given design speed, regardless of the method used.
4.7.4 Superelevation Rates on Low-Speed Rural Town, Suburban, Urban and Urban Core Facilities
Although superelevation is advantageous for traffic operations, various factors often combine to make its use impractical in many rural town, suburban, urban, and urban core areas. These factors include the following:
- Wide pavement areas;
- Surface drainage considerations;
- Frequency of cross streets and driveways; and
- Need to meet the grade of adjacent property.
For these reasons, horizontal curves on low-speed rural town, suburban, urban, and urban core facilities are frequently designed with normal crown. The centripetal acceleration, in this case, is counteracted solely with side friction. The term
“normal crown”
(NC) represents an equal downward pavement cross-slope, typically 2 percent, on each side of the axis of rotation.Low-speed rural town, suburban, urban, and urban core facilities should be designed using NC, such that superelevation is not necessary where practical. This is accomplished by using the negative e-values from
.
However, when superelevation is needed, a maximum superelevation rate of 4 percent should be used. This is accomplished by using the positive e-values from
.
Low-Speed (≤ 45 mph) | Intermediate-Speed (50 – 60 mph) | High-Speed (65 mph and greater) | |
Urban All Functional Classifications (Excluding Freeway Mainlanes, Ramps and Direct Connectors) | Method 2 Table 4-4 | Method 5 4%, 6% or 8% emax Table 4-5, Table 4-6 or Table 4-7 | Method 5 6% or 8% emax Table 4-6 or Table 4-7 |
Rural All Functional Classifications | Method 5 6% or 8% emax Table 4-6, or Table 4-7 | ||
Urban or Rural Freeway Mainlanes, Ramps, and Direct Connectors | Method 5 6% or 8% emax Table 4-6 or Table 4-7 | ||
Urban Frontage Roads | Method 2 Table 4-4 | Method 5 4%, 6% or 8% emax Table 4-5, Table 4-6 or Table 4-7 | Method 5 6% or 8% emax Table 4-6 or Table 4-7 |
Rural Frontage Roads | Method 5 6% or 8% emax Table 4 6 or Table 4 7 | ||
Urban Ramps for Grade Separations on Non-Access Controlled Facilities | Method 2 Table 4 4 | Method 5 4%, 6% or 8% emax Table 4-5, Table 4-6 or Table 4-7 | Method 5 6% or 8% emax Table 4-6 or Table 4-7 |
Rural Ramps for Grade Separations on Non-Access Controlled Facilities | Method 5 6% or 8% emax Table 4 6 or Table 4 7 | ||
Roundabouts and Alternative Intersections (Including Approaches) 2 | Method 2 Table 4-4 | Method 5 4%, 6% or 8% emax Table 4-5, Table 4-6 or Table 4-7 | N/A |
Temporary Traffic Control 3 | Method 2 expanded Table 23-1 | ||
Low-Volume Off-System Bridges (approach roadway) | Meet or improve conditions that are typical on the remainder of the roadway | ||
Notes: | |||
| |||
Design Speed | |||||||
e (%) | 15 mph R (ft) | 20 mph R (ft) | 25 mph R (ft) | 30 mph R (ft) | 35 mph R (ft) | 40 mph R (ft) | 45 mph R (ft) |
-4.0 2 | 54 | 116 | 219 | 375 | 583 | 889 | 1227 |
-3.0 2 | 52 | 111 | 208 | 353 | 544 | 821 | 1125 |
-2.8 2 | 51 | 110 | 206 | 349 | 537 | 808 | 1107 |
-2.6 2 | 51 | 109 | 204 | 345 | 530 | 796 | 1089 |
-2.5 2,3 | 51 | 109 | 203 | 343 | 527 | 790 | 1080 |
-2.4 2 | 51 | 108 | 202 | 341 | 524 | 784 | 1071 |
-2.2 2 | 50 | 108 | 200 | 337 | 517 | 773 | 1055 |
-2.0 | 50 | 107 | 198 | 333 | 510 | 762 | 1039 |
-1.5 4,5 | 49 | 105 | 194 | 324 | 495 | 736 | 1000 |
-1.0 4,5 | 48 | 103 | 189 | 316 | 480 | 711 | 964 |
-0.5 4,5 | 48 | 101 | 185 | 308 | 467 | 688 | 931 |
0 5,6 | 47 | 99 | 181 | 300 | 454 | 667 | 900 |
0.5 5 | 46 | 97 | 177 | 293 | 441 | 646 | 871 |
1.0 5 | 45 | 95 | 174 | 286 | 430 | 627 | 844 |
1.5 5 | 45 | 94 | 170 | 279 | 419 | 610 | 818 |
2.0 | 44 | 92 | 167 | 273 | 408 | 593 | 794 |
2.2 | 44 | 91 | 165 | 270 | 404 | 586 | 785 |
2.4 | 44 | 91 | 164 | 268 | 400 | 580 | 776 |
2.6 | 43 | 90 | 163 | 265 | 396 | 573 | 767 |
2.8 | 43 | 89 | 161 | 263 | 393 | 567 | 758 |
3.0 | 43 | 89 | 160 | 261 | 389 | 561 | 750 |
3.2 | 43 | 88 | 159 | 259 | 385 | 556 | 742 |
3.4 | 42 | 88 | 158 | 256 | 382 | 550 | 734 |
3.6 | 42 | 87 | 157 | 254 | 378 | 544 | 726 |
3.8 | 42 | 87 | 155 | 252 | 375 | 539 | 718 |
4.0 | 42 | 86 | 154 | 250 | 371 | 533 | 711 |
Notes: | |||||||
| |||||||
, which is based on the Method 2 superelevation distribution, shows the relationship of radius, superelevation rate, and design speed for low-speed rural town, suburban, urban, and urban core facility design and should be used to evaluate existing conditions or the need for superelevation for proposed conditions on low-speed rural town, suburban, urban, and urban core facilities.
This table may also be used for design of detour alignments in constrained conditions.
For a normal crown section, the negative e-value (the slope on the outside of the curve) will always be the controlling value for a given design speed.
Example: Given a design speed of 35 mph and a 400-ft radius curve,
indicates an approximate superelevation rate of 2.4 percent should be used.
4.7.5 Superelevation Rate on Rural and High-Speed Suburban, Urban, and Urban Core Facilities
These tables should be used for rural and highspeed suburban, urban, and urban core facilities.
For multi-lane facilities, particularly where wide medians are used, the radius applies to the inside edge of the innermost travel lane.
Design Speed | ||||||||||
e (%) | 15 mph R(ft) | 20 mph R(ft) | 25 mph R(ft) | 30 mph R(ft) | 35 mph R(ft) | 40 mph R(ft) | 45 mph R(ft) | 50 mph R(ft) | 55 mph R(ft) | 60 mph R(ft) |
RC 4,5 | 4,940 | 5,950 | 7,080 | |||||||
2.2 | 4,280 | 5,180 | 6,190 | |||||||
2.4 | 3,690 | 4,500 | 5,410 | |||||||
2.6 | 3,130 | 3,870 | 4,700 | |||||||
2.8 | 2,660 | 3,310 | 4,060 | |||||||
3.0 | 2,290 | 2,860 | 3,530 | |||||||
3.2 | 1,980 | 2,490 | 3,090 | |||||||
3.4 | 1,720 | 2,170 | 2,700 | |||||||
3.6 | 1,480 | 1,880 | 2,350 | |||||||
3.8 | 1,260 | 1,600 | 2,010 | |||||||
4.0 | 926 | 1,190 | 1,500 | |||||||
Notes: | ||||||||||
| ||||||||||
Design Speed | ||||||||||||||
e (%) | 15 mph R (ft) | 20 mph R (ft) | 25 mph R (ft) | 30 mph R (ft) | 35 mph R (ft) | 40 mph R (ft) | 45 mph R (ft) | 50 mph R (ft) | 55 mph R (ft) | 60 mph R (ft) | 65 mph R (ft) | 70 mph R (ft) | 75 mph R (ft) | 80 mph R (ft) |
NC 2,4 | 868 | 1,580 | 2,290 | 3,130 | 4,100 | 5,230 | 6,480 | 7,870 | 9,410 | 11,100 | 12,600 | 14,100 | 15,700 | 17,400 |
RC 3,4 | 614 | 1,120 | 1,630 | 2,240 | 2,950 | 3,770 | 4,680 | 5,700 | 6,820 | 8,060 | 9,130 | 10,300 | 11,500 | 12,900 |
2.2 | 543 | 991 | 1,450 | 2,000 | 2,630 | 3,370 | 4,190 | 5,100 | 6,110 | 7,230 | 8,200 | 9,240 | 10,400 | 11,600 |
2.4 | 482 | 884 | 1,300 | 1,790 | 2,360 | 3,030 | 3,770 | 4,600 | 5,520 | 6,540 | 7,430 | 8,380 | 9,420 | 10,600 |
2.6 | 430 | 791 | 1,170 | 1,610 | 2,130 | 2,740 | 3,420 | 4,170 | 5,020 | 5,950 | 6,770 | 7,660 | 8,620 | 9,670 |
2.8 | 384 | 709 | 1,050 | 1,460 | 1,930 | 2,490 | 3,110 | 3,800 | 4,580 | 5,440 | 6,200 | 7,030 | 7,930 | 8,910 |
3.0 | 341 | 635 | 944 | 1,320 | 1,760 | 2,270 | 2,840 | 3,480 | 4,200 | 4,990 | 5,710 | 6,490 | 7,330 | 8,260 |
3.2 | 300 | 566 | 850 | 1,200 | 1,600 | 2,080 | 2,600 | 3,200 | 3,860 | 4,600 | 5,280 | 6,010 | 6,810 | 7,680 |
3.4 | 256 | 498 | 761 | 1,080 | 1,460 | 1,900 | 2,390 | 2,940 | 3,560 | 4,250 | 4,890 | 5,580 | 6,340 | 7,180 |
3.6 | 209 | 422 | 673 | 972 | 1,320 | 1,740 | 2,190 | 2,710 | 3,290 | 3,940 | 4,540 | 5,210 | 5,930 | 6,720 |
3.8 | 176 | 358 | 583 | 864 | 1,190 | 1,590 | 2,010 | 2,490 | 3,040 | 3,650 | 4,230 | 4,860 | 5,560 | 6,320 |
4.0 | 151 | 309 | 511 | 766 | 1,070 | 1,440 | 1,840 | 2,300 | 2,810 | 3,390 | 3,950 | 4,550 | 5,220 | 5,950 |
4.2 | 131 | 270 | 452 | 684 | 960 | 1,310 | 1,680 | 2,110 | 2,590 | 3,140 | 3,680 | 4,270 | 4,910 | 5,620 |
4.4 | 116 | 238 | 402 | 615 | 868 | 1,190 | 1,540 | 1,940 | 2,400 | 2,920 | 3,440 | 4,010 | 4,630 | 5,320 |
4.6 | 102 | 212 | 360 | 555 | 788 | 1,090 | 1,410 | 1,780 | 2,210 | 2,710 | 3,220 | 3,770 | 4,380 | 5,040 |
4.8 | 91 | 189 | 324 | 502 | 718 | 995 | 1,300 | 1,640 | 2,050 | 2,510 | 3,000 | 3,550 | 4,140 | 4,790 |
5.0 | 82 | 169 | 292 | 456 | 654 | 911 | 1,190 | 1,510 | 1,890 | 2,330 | 2,800 | 3,330 | 3,910 | 4,550 |
5.2 | 73 | 152 | 264 | 413 | 595 | 833 | 1,090 | 1,390 | 1,750 | 2,160 | 2,610 | 3,120 | 3,690 | 4,320 |
5.4 | 65 | 136 | 237 | 373 | 540 | 759 | 995 | 1,280 | 1,610 | 1,990 | 2,420 | 2,910 | 3,460 | 4,090 |
5.6 | 58 | 121 | 212 | 335 | 487 | 687 | 903 | 1,160 | 1,470 | 1,830 | 2,230 | 2,700 | 3,230 | 3,840 |
5.8 | 51 | 106 | 186 | 296 | 431 | 611 | 806 | 1,040 | 1,320 | 1,650 | 2,020 | 2,460 | 2,970 | 3,560 |
6.0 | 39 | 81 | 144 | 231 | 340 | 485 | 643 | 833 | 1,060 | 1,330 | 1,660 | 2,040 | 2,500 | 3,050 |
Notes: | ||||||||||||||
| ||||||||||||||
Design Speed | ||||||||||||||
e (%) | 15 mph R (ft) | 20 mph R (ft) | 25 mph R (ft) | 30 mph R (ft) | 35 mph R (ft) | 40 mph R (ft) | 45 mph R (ft) | 50 mph R (ft) | 55 mph R (ft) | 60 mph R (ft) | 65 mph R (ft) | 70 mph R (ft) | 75 mph R (ft) | 80 mph R (ft) |
NC 2,4 | 932 | 1,640 | 2,370 | 3,240 | 4,260 | 5,410 | 6,710 | 8,150 | 9,720 | 11,500 | 12,900 | 14,500 | 16,100 | 17,800 |
RC 3,4 | 676 | 1,190 | 1,720 | 2,370 | 3,120 | 3,970 | 4,930 | 5,990 | 7,150 | 8,440 | 9,510 | 10,700 | 12,000 | 13,300 |
2.2 | 605 | 1,070 | 1,550 | 2,130 | 2,800 | 3,570 | 4,440 | 5,400 | 6,450 | 7,620 | 8,600 | 9,660 | 10,800 | 12,000 |
2.4 | 546 | 959 | 1,400 | 1,930 | 2,540 | 3,240 | 4,030 | 4,910 | 5,870 | 6,930 | 7,830 | 8,810 | 9,850 | 11,000 |
2.6 | 496 | 872 | 1,280 | 1,760 | 2,320 | 2,960 | 3,690 | 4,490 | 5,370 | 6,350 | 7,180 | 8,090 | 9,050 | 10,100 |
2.8 | 453 | 796 | 1,170 | 1,610 | 2,130 | 2,720 | 3,390 | 4,130 | 4,950 | 5,850 | 6,630 | 7,470 | 8,370 | 9,340 |
3.0 | 415 | 730 | 1,070 | 1,480 | 1,960 | 2,510 | 3,130 | 3,820 | 4,580 | 5,420 | 6,140 | 6,930 | 7,780 | 8,700 |
3.2 | 382 | 672 | 985 | 1,370 | 1,820 | 2,330 | 2,900 | 3,550 | 4,250 | 5,040 | 5,720 | 6,460 | 7,260 | 8,130 |
3.4 | 352 | 620 | 911 | 1,270 | 1,690 | 2,170 | 2,700 | 3,300 | 3,970 | 4,700 | 5,350 | 6,050 | 6,800 | 7,620 |
3.6 | 324 | 572 | 845 | 1,180 | 1,570 | 2,020 | 2,520 | 3,090 | 3,710 | 4,400 | 5,010 | 5,680 | 6,400 | 7,180 |
3.8 | 300 | 530 | 784 | 1,100 | 1,470 | 1,890 | 2,360 | 2,890 | 3,480 | 4,140 | 4,710 | 5,350 | 6,030 | 6,780 |
4.0 | 277 | 490 | 729 | 1,030 | 1,370 | 1,770 | 2,220 | 2,720 | 3,270 | 3,890 | 4,450 | 5,050 | 5,710 | 6,420 |
4.2 | 255 | 453 | 678 | 955 | 1,280 | 1,660 | 2,080 | 2,560 | 3,080 | 3,670 | 4,200 | 4,780 | 5,410 | 6,090 |
4.4 | 235 | 418 | 630 | 893 | 1,200 | 1,560 | 1,960 | 2,410 | 2,910 | 3,470 | 3,980 | 4,540 | 5,140 | 5,800 |
4.6 | 215 | 384 | 585 | 834 | 1,130 | 1,470 | 1,850 | 2,280 | 2,750 | 3,290 | 3,770 | 4,310 | 4,890 | 5,530 |
4.8 | 193 | 349 | 542 | 779 | 1,060 | 1,390 | 1,750 | 2,160 | 2,610 | 3,120 | 3,590 | 4,100 | 4,670 | 5,280 |
5.0 | 172 | 314 | 499 | 727 | 991 | 1,310 | 1,650 | 2,040 | 2,470 | 2,960 | 3,410 | 3,910 | 4,460 | 5,050 |
5.2 | 154 | 284 | 457 | 676 | 929 | 1,230 | 1,560 | 1,930 | 2,350 | 2,820 | 3,250 | 3,740 | 4,260 | 4,840 |
5.4 | 139 | 258 | 420 | 627 | 870 | 1,160 | 1,480 | 1,830 | 2,230 | 2,680 | 3,110 | 3,570 | 4,090 | 4,640 |
5.6 | 126 | 236 | 387 | 582 | 813 | 1,090 | 1,390 | 1,740 | 2,120 | 2,550 | 2,970 | 3,420 | 3,920 | 4,460 |
5.8 | 115 | 216 | 358 | 542 | 761 | 1,030 | 1,320 | 1,650 | 2,010 | 2,430 | 2,840 | 3,280 | 3,760 | 4,290 |
6.0 | 105 | 199 | 332 | 506 | 713 | 965 | 1,250 | 1,560 | 1,920 | 2,320 | 2,710 | 3,150 | 3,620 | 4,140 |
6.2 | 97 | 184 | 308 | 472 | 669 | 909 | 1,180 | 1,480 | 1,820 | 2,210 | 2,600 | 3,020 | 3,480 | 3,990 |
6.4 | 89 | 170 | 287 | 442 | 628 | 857 | 1,110 | 1,400 | 1,730 | 2,110 | 2,490 | 2,910 | 3,360 | 3,850 |
6.6 | 82 | 157 | 267 | 413 | 590 | 808 | 1,050 | 1,330 | 1,650 | 2,010 | 2,380 | 2,790 | 3,240 | 3,720 |
6.8 | 76 | 146 | 248 | 386 | 553 | 761 | 990 | 1,260 | 1,560 | 1,910 | 2,280 | 2,690 | 3,120 | 3,600 |
7.0 | 70 | 135 | 231 | 360 | 518 | 716 | 933 | 1,190 | 1,480 | 1,820 | 2,180 | 2,580 | 3,010 | 3,480 |
7.2 | 64 | 125 | 214 | 336 | 485 | 672 | 878 | 1,120 | 1,400 | 1,720 | 2,070 | 2,470 | 2,900 | 3,370 |
7.4 | 59 | 115 | 198 | 312 | 451 | 628 | 822 | 1,060 | 1,320 | 1,630 | 1,970 | 2,350 | 2,780 | 3,250 |
7.6 | 54 | 105 | 182 | 287 | 417 | 583 | 765 | 980 | 1,230 | 1,530 | 1,850 | 2,230 | 2,650 | 3,120 |
7.8 | 48 | 94 | 164 | 261 | 380 | 533 | 701 | 901 | 1,140 | 1,410 | 1,720 | 2,090 | 2,500 | 2,970 |
8.0 | 38 | 76 | 134 | 214 | 314 | 444 | 587 | 758 | 960 | 1200 | 1,480 | 1,810 | 2,210 | 2,670 |
Notes: | ||||||||||||||
| ||||||||||||||
4.7.6 Superelevation Transition Length
Superelevation transition is the general term denoting the change in cross slope from a normal crown section to the full superelevated section or vice versa. To meet the requirements of comfort and safety, the superelevation transition should occur over a length adequate for the usual travel speeds.
Transition lengths should also account for potential future traveled way widening, including widening associated with the ultimate typical section in a schematic.
Preferable design values for length of superelevation transition are based on a given maximum relative gradient between profiles of the edge of traveled way and the axis of rotation.
shows recommended maximum relative gradient values. Transition length on this basis is directly proportional to the total superelevation, which is the product of the lane width and the change in cross slope.
Design Speed (mph) | Maximum Relative Gradient 1 (%) | Equivalent Maximum Relative Slope (run:rise) |
15 | 0.89 | 1:112 |
20 | 0.80 | 1:125 |
25 | 0.73 | 1:137 |
30 | 0.67 | 1:150 |
35 | 0.62 | 1:162 |
40 | 0.57 | 1:175 |
45 | 0.53 | 1:187 |
≥50 | 0.50 | 1:200 |
Notes: | ||
| ||
Preferable transition length, L
CT
, can be calculated using the following equation:Where:
L
Calculated preferable transition length, ft CT (preferable)
= CS =
Change in cross slope of superelevated pavement, percent W =
distance between the axis of rotation and the edge of traveled way, ft G =
maximum relative gradient (%).Example determinations of superelevation transition are shown in
.
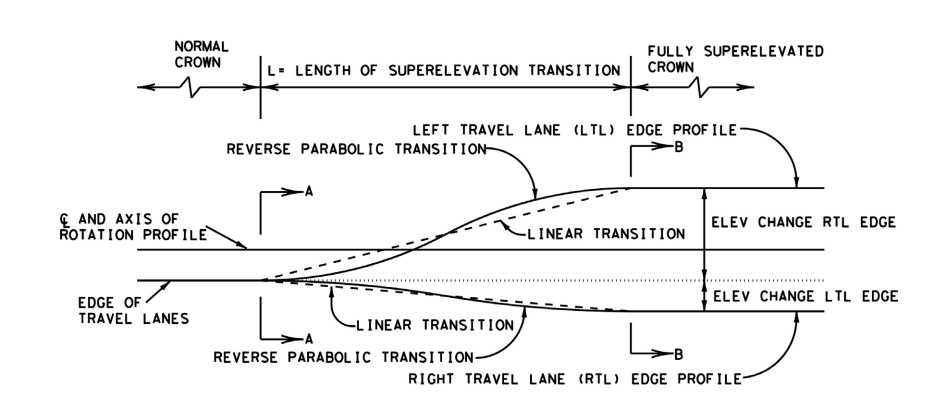
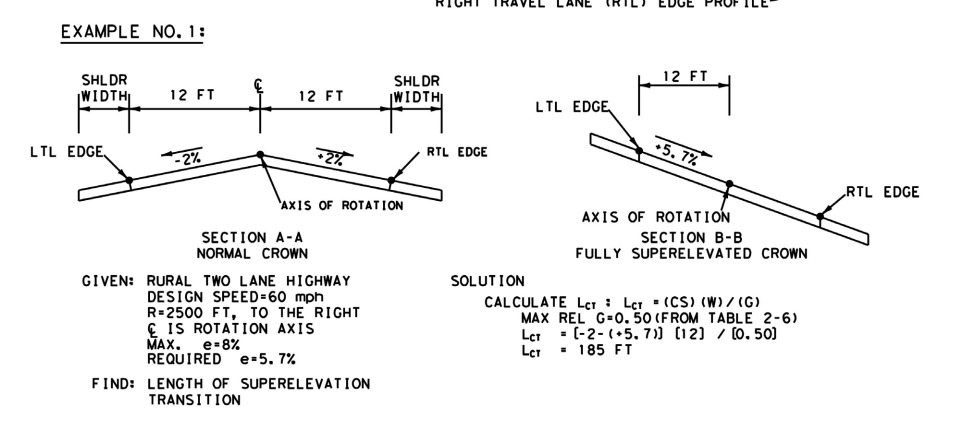

Figure 4-2: Determination of Length of Superelevation Transition
As the number of lanes to be transitioned increases, the length of superelevation transition increases proportionately with the increased width. While strict adherence to the length (L
CT
) calculation is preferable, the length for multilane facilities may become impractical for design purposes (e.g., drainage problems, avoiding bridges, accommodating merge/diverge condition).A minimum length (L
CT
), can be calculated using adjustment factors as shown in
, such that the transition length formula becomes:where “b” is defined in Table 4-9.
In the case of one lane being rotated, “b” is 1.0, such that L
CT (min)
= LCT (preferable)
Number of Lanes Rotated (n) | Adjustment Factor 2 (b) |
1.5 | 0.83 |
2 | 0.75 |
2.5 | 0.70 |
3 | 0.67 |
3.5 | 0.64 |
4 | 0.63 |
4.5 | 0.61 |
5 | 0.60 |
Notes: | |
| |
4.7.7 Superelevation Transition Placement
The transition with respect to the termini of a simple (circular) curve should be placed to minimize lateral acceleration and the vehicle's lateral motion. The recommended allocation of superelevation transition on the tangent, preceding or following a curve, is provided on
. For superelevation on bridge structures, it is preferred to begin/end superelevation at the bridge bent line. When spiral curves are present on an existing facility and alignment modifications aren’t practical, refer to
for transition distribution.
Design Speed (mph) | No. of Lanes Rotated | |||
1.0 | 1.5 | 2.0 - 2.5 | 3.0 - 3.5 | |
15 - 45 | 0.80 | 0.85 | 0.90 | 0.90 |
50 - 80 | 0.70 | 0.75 | 0.80 | 0.85 |
Notes: | ||||
| ||||
Care must be exercised in designing the length and location of the superelevation transition. Pavement surfaces should be modeled to ensure proper drainage, especially near the high or low portions of Type I or III vertical curves (see
for curve types).
A plot of roadway contours may assist with the verification of grades and identification of drainage problems in areas of superelevation transition. Preferably,
a minimum profile grade line (PGL) of 0.5 percent and minimum edge-of-pavement (EOP) profile grade of 0.2 percent (0.5 percent for curbed roadways) should be maintained throughout the
At a minimum, either criterion should be met.superelevation transition section
.On existing alignments, whenever reverse curves are closely spaced and superelevation transition lengths overlap, transition lengths (L
CT
) should be adjusted to ensure that roadway cross slopes are in the proper direction for each horizontal curve. For proposed construction of new facilities, the tangent section between reverse curves should be of sufficient length such that minimum transition lengths for each transition do not overlap.4.7.8 Superelevation Transition Type
Linear or reverse parabolic transitions may be used for attaining superelevation.
Where appearance is a factor (e.g., curbed sections and retaining walls) use of reverse parabolic is recommended.
This produces an outer edge profile that is smooth, undistorted, and pleasing in appearance. However, for bridges, linear transitions are generally preferred
for constructability, ride quality, and lower cost.Notate the transition type in the plans to ensure the transition is properly constructed.
shows reverse parabolic and linear transitions over the full length of the transition. Refer to
for alternative methods for developing smooth-edge profiles over the length of the transition.
4.7.9 Sight Distance on Horizontal Curves
Where an object off the pavement restricts sight distance, such as a bridge pier, bridge railing, median barrier, retaining wall, building, cut slope or natural growth,
the minimum radius of curvature is determined by the stopping sight distance.
The following equation applies only to circular curves longer than the stopping sight distance (S<L) for the pertinent design speed. For example, with a 50-mph design speed and a curve with a 1,150-ft radius, a clear sight area with a horizontal sight line offset (HSO) of approximately 20-ft is needed for stopping sight distance.
Where:
HSO =
horizontal sight line offset, ft S =
stopping sight distance (
), ft R =
radius at centerline of inner most travel lane, ftThis method for calculating HSO is only exact when both the vehicle and sight obstruction are located within the horizontal curve. When the vehicle or sight obstruction are located outside of the horizontal curve (i.e., S>L) this method will result in an HSO slightly larger than required. In many instances the resulting additional clearance will not be significant. In some cases, the design should be checked either by using graphical procedures (2D or 3D) or computational methods to verify HSO. NHCRP 910 provides computational methods for verifying HSO.
In cases where complex geometries or discontinuous objects cause sight obstructions, graphical methods may be useful in determining available sight distance and associated offset requirements. Graphical methods may also be used when the circular curve is shorter than the stopping sight distance.
To check horizontal sight distance on the inside of a curve graphically, sight lines equal to the required sight distance on horizontal curves should be reviewed to ensure that obstructions such as buildings, hedges, barrier railing, and high ground do not restrict the sight distance required in either direction.
illustrates a graphical approach to determining horizontal sight distance in a curve.
Where sufficient stopping sight distance is not available because a railing, longitudinal barrier or other features constitutes a sight obstruction, alternative designs should be considered. Potential alternatives include:
- Increasing the offset to the obstruction; or
- Increasing the radius.
However, the alternative should not incorporate a shoulder width on the inside of the curve more than 12-ft because of the concern that drivers will use wider shoulders as a passing or travel lane.
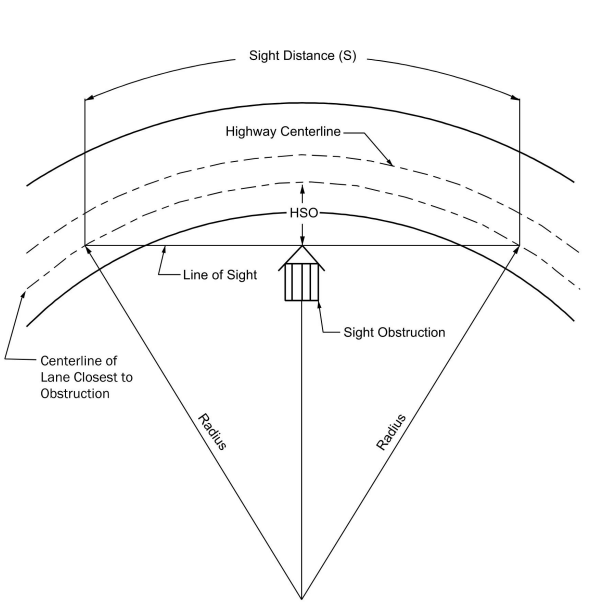
Figure 4-3: Diagram Illustrating Components for Determining Horizontal Sight Distance
Source: AASHTO A Policy on Geometric Design of Highways and Streets