4.11 Sight Distance
This section provides descriptions and information on sight distance, one of several principal elements of design that are common to all types of highways and streets. Of utmost importance in highway design is the arrangement of geometric elements so that there is adequate sight distance for safe and efficient traffic operation assuming adequate light, clear atmospheric conditions, and drivers' visual acuity. For design, the following five types of sight distance are considered:
- Stopping Sight Distance;
- Decision Sight Distance;
- Passing Sight Distance;
- Intersection Sight Distance; and
- Sight Distance at Under crossings.
4.11.1 Stopping Sight Distance
Sight distance is the length of roadway ahead that is visible to the driver. The available sight distance on a roadway should be sufficiently long enough to enable a vehicle traveling at or near the design speed to stop before reaching a stationary object in its path.
Stopping sight distance is the sum of two distances:
Brake reaction distance –
the distance traversed by the vehicle from the instant the driver sights an object necessitating a stop to the instant the brakes are applied.Braking distance –
the distance needed to stop the vehicle from the instant brake application begins on level terrain.Approximately 90 percent of all drivers decelerate at rates greater than 11.2 ft/s
2
. Such decelerations allow the driver to maintain steering control during the braking maneuver on wet surfaces. Therefore, 11.2 ft/s
2
is recommended as the deceleration threshold for determining stopping sight distance.In computing and measuring stopping sight distance, the height of the driver’s eye is estimated to be 3.5-ft and the height of the object to be seen by the driver is 2.0-ft, equivalent to the taillight height of a passenger car.
The calculated and design stopping sight distance are shown in
.
The values given in
represent stopping sight distance on level terrain. As a general rule, the sight distance available on downgrades is larger than on upgrades, therefore, corrections for grade are usually unnecessary.
An example where correction for grade might be applicable for stopping sight distance would be a divided roadway with independent design profiles in extreme rolling or mountainous terrain.
The calculated corrections for these types of factors are given in
. The computed distances for various speeds at the assumed conditions on level roadways are developed from the equations below.
Where:
SSD =
stopping sight distance, ft V =
design speed, mph T =
brake reaction time, 2.5 s A =
deceleration rate, ft/s2
When a highway is on a grade the equation for braking distance is modified to include the grade as shown below:
Where:
d
braking distance on grade, ft B
=V =
design speed, mph A =
deceleration, ft/s2
G =
grade, rise/run, ft/ftThe stopping sight distances for various grades are shown in
these values are determined using the equation above.
Design Speed (mph) | Brake Reaction Distance 1 (ft) | Braking Distance (ft) | Stopping Sight Distance | |
Calculated (ft) | Design (ft) | |||
15 | 55.1 | 21.6 | 76.7 | 80 |
20 | 73.5 | 38.4 | 111.9 | 115 |
25 | 91.9 | 60.0 | 151.9 | 155 |
30 | 110.3 | 86.4 | 196.7 | 200 |
35 | 128.6 | 117.6 | 246.2 | 250 |
40 | 147.0 | 153.6 | 300.6 | 305 |
45 | 165.4 | 194.4 | 359.8 | 360 |
50 | 183.8 | 240.0 | 423.8 | 425 |
55 | 202.1 | 290.3 | 492.4 | 495 |
60 | 220.5 | 345.5 | 566.0 | 570 |
65 | 238.9 | 405.5 | 644.4 | 645 |
70 | 257.3 | 470.3 | 727.6 | 730 |
75 | 275.6 | 539.9 | 815.5 | 820 |
80 | 294.0 | 614.3 | 908.3 | 910 |
Notes: | ||||
| ||||
Design Speed (mph) | Stopping Sight Distance (ft) | |||||
Downgrades | Upgrades | |||||
3% | 6% | 9% | 3% | 6% | 9% | |
15 | 80 | 82 | 86 | 75 | 74 | 73 |
20 | 116 | 120 | 126 | 109 | 107 | 104 |
25 | 158 | 165 | 173 | 147 | 143 | 140 |
30 | 205 | 215 | 227 | 200 | 184 | 179 |
35 | 257 | 271 | 287 | 237 | 229 | 222 |
40 | 315 | 333 | 354 | 289 | 278 | 269 |
45 | 378 | 400 | 427 | 344 | 331 | 320 |
50 | 446 | 474 | 507 | 405 | 388 | 375 |
55 | 520 | 553 | 593 | 469 | 450 | 433 |
60 | 598 | 638 | 686 | 538 | 515 | 495 |
65 | 682 | 728 | 785 | 612 | 584 | 561 |
70 | 771 | 825 | 891 | 690 | 658 | 631 |
75 | 866 | 927 | 1003 | 772 | 736 | 704 |
80 | 965 | 1035 | 1121 | 859 | 817 | 782 |
4.11.2 Decision Sight Distance
Decision sight distance is the distance required for a driver to detect an unexpected or otherwise difficult-to-perceive information source, recognize the source, select an appropriate speed and path, and initiate and complete the required maneuver safely and efficiently.
Because decision sight distance gives drivers additional margin for error and affords them sufficient length to maneuver their vehicles at the same or reduced speed rather than to just stop, its values are substantially greater than stopping sight distance.
shows recommended decision sight distance values for various avoidance maneuvers
Design Speed (mph) | Avoidance Maneuver Decision Sight Distance (ft) | ||||
A 1 | B 2 | C 3 | D 4 | E 5 | |
30 | 220 | 490 | 450 | 535 | 620 |
35 | 275 | 590 | 525 | 625 | 720 |
40 | 330 | 690 | 600 | 715 | 825 |
45 | 395 | 800 | 675 | 800 | 930 |
50 | 465 | 910 | 750 | 890 | 1030 |
55 | 535 | 1030 | 865 | 980 | 1135 |
60 | 610 | 1150 | 990 | 1125 | 1280 |
65 | 695 | 1275 | 1050 | 1220 | 1365 |
70 | 780 | 1410 | 1105 | 1275 | 1445 |
75 | 875 | 1545 | 1180 | 1365 | 1545 |
80 | 970 | 1685 | 1260 | 1455 | 1650 |
Notes: | |||||
| |||||
Examples of situations in which decision sight distance is preferred
include the following:- Interchange and intersection locations where unusual or unexpected maneuvers are required (such as exit ramp gore areas and left-side exits);
- Changes in cross-section such as lane drops; and
- Areas of concentrated demand where “visual noise” is present with competing sources of visual information, such as roadway elements, traffic elements, traffic control devices, and advertising signs.
Locations along the roadway where a driver has stopping sight distance but not the extra response time provided by decision sight distance is identified as a
“reduced decision zone.”
Avoid placement of intersections within a reduced decision zone by relocating the intersection or by changing the grades to reduce the length of the reduced decision zone.4.11.3 Passing Sight Distance
Passing sight distance is the distance required by a driver to make a passing maneuver without cutting off the passed vehicle and before meeting an opposing vehicle. Therefore, passing sight distance is applicable to two-lane highways only (including two-way frontage roads).
Recommended passing sight distances are based on the following assumptions:
- The speeds of the passing and opposing vehicles are equal and represent the design speed of the highway;
- The passed vehicle travels at a uniform speed and the speed difference between the passing and passed vehicles is 12 mph;
- The passing vehicle has sufficient acceleration capability to reach the specified speed difference relative to the passed vehicle by the time it reaches the critical position, which generally occurs about 40 percent of the way through the passing maneuver;
- The lengths of the passing and passed vehicles are 19-ft;
- The passing driver’s perception-reaction time in deciding to abort passing a vehicle is 1-s;
- If the passing maneuver is aborted, the passing vehicles will use a deceleration rate of 11.2 ft/s2, the same deceleration rate used in stopping sight distance design criteria;
- For a completed or aborted pass, the space headway between passing and passed vehicles is 1-s; and
- The minimum clearance between passing and opposing vehicles at the point at which the passing vehicle returns to its normal lane is 1-s.
In the design of two-lane highways, minimum or greater passing sight distance should be provided wherever practical, since less than minimum distances reduce the safety and LOS of the roadway. For rolling terrain, provision of climbing lanes may be a more economical alternative than achieving a vertical alignment with adequate passing sight distance.
The minimum passing sight distance for a two-lane road is about twice the minimum stopping sight distance at the same design speed. To meet those greater sight distances, clear sight areas on the inside of curves should be provided. For cut sections, designing for passing sight distance should be limited to tangents and very flat curves. Even in level terrain, providing passing sight distance would need a clear area inside each curve that would, in some instances, extend beyond the normal ROW line.
Minimum passing sight distance values for design of two-lane highways are shown in
.
These distances are for design purposes only and should not be confused with other distances used as warrants for striping no-passing zones as shown in the
. For the design of typical two-lane rural highways, except for level terrain, provision of near continuous passing sight distance is impractical. However, the designer should attempt to increase the length and frequency of passing sections where economically feasible.K-Values for Determining Length of Crest Vertical Curve for Various Passing Sight Distances (PSD) | ||
K-Values for Determining Length of Crest Vertical Curve for Various Passing Sight Distances (PSD) | ||
Design Speed (mph) | Minimum PSD for Design (ft.) | Minimum K-Value 1 |
20 | 400 | 57 |
25 | 450 | 72 |
30 | 500 | 89 |
35 | 550 | 108 |
40 | 600 | 129 |
45 | 700 | 175 |
50 | 800 | 229 |
55 | 900 | 289 |
60 | 1000 | 357 |
65 | 1100 | 432 |
70 | 1200 | 514 |
75 | 1300 | 604 |
80 | 1400 | 700 |
Notes: | ||
| ||
4.11.4 Intersection Sight Distance
Intersection sight distance is fundamental to intersection operation and
should be calculated at every intersection
to ensure a safe and traversable intersection. Calculations and more information about intersection sight distance can be found in
.4.11.5 Sight Distance at Under-Crossings
Sight distance through a grade crossing should be at least the minimum stopping sight distance, or longer. Line of sight may be obstructed by an overpass structure and can limit the sight distance for the operator. Where practical, provide the minimum length of sag vertical curve at grade separated structures. Where economically feasible, for two-lane roadways, the passing sight distance should be maintained.
When the minimum sag vertical curve length based on headlight sight distance, as described in
, is achieved for vertical clearances of 14-ft or higher, then
and subsequent equations are not applicable. However, if any of the following conditions occur, then the under-crossing curve length as shown in
and subsequent equations should be verified based on the applicable stopping sight distance (SSD):
- The minimum sag vertical curve length based on SSD for headlights is not met;
- The comfort control (lighting) criteria is used to establish the sag vertical curve length; and
- The vertical clearance is less than 14-ft.
The general equations for sag vertical curve length at under-crossings are:
Case 1 –
Sight distance greater than length of vertical Curve (S>L):Where:
L =
length of vertical curve, ft S =
sight distance, ft C =
vertical clearance, ft h
eye height, ft 1
=h
height of object, ft 2
=A =
algebraic difference in grades, percent Case 2 –
Sight distance less than length of vertical curve (S<L)Using an eye height of 8.0-ft for a truck driver and an object height of 2.0-ft for the taillights of a vehicle, the following equations can be derived:
Case 1 –
Sight distance greater than length of vertical curve (S>L):Case 2 –
Sight distance less than length of vertical curve (S<L)Where:
L =
length of vertical curve, ft S =
sight distance, ft C =
vertical clearance, ft h
height of eye, ft 1
=h
height of object, ft 2
=A =
algebraic difference in grades, percent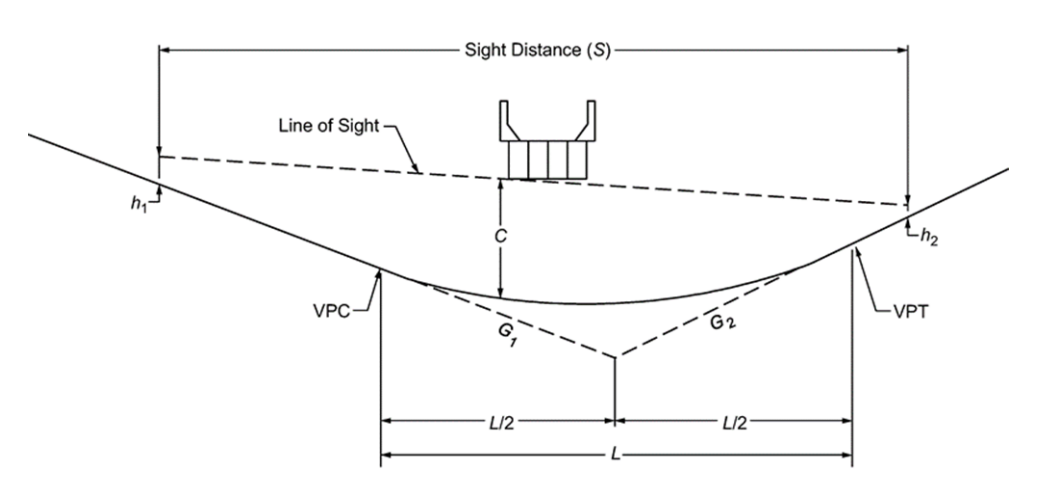
Figure 4-29: Sight Distance at Under-Crossings
Source: AASHTO A Policy on Geometric Design of Highways and Streets