4.8 Vertical Alignment
The two basic elements of vertical alignment are:
- Grades; and
- Vertical curves.
4.8.1 Grades
The effects of rate and length of grade are more pronounced on the operating characteristics of trucks than on passenger cars and thus may introduce undesirable speed differentials between the vehicle types. The term
“critical length of grade”
is used to indicate the maximum length of a specified ascending gradient upon which a loaded truck can operate without an unreasonable reduction in speed (commonly 10 mph).
shows the relationship of percent upgrade, length of grade, and speed reduction for a representative truck (200-lb/hp weight/power ratio) with an entering speed of 70 mph. For additional entry speeds and/or design vehicles see
.Where critical length of grade is exceeded for any type of two-lane facility, climbing lanes should be considered as discussed in the HCM.
When the critical length of grade values shown in
are exceeded, consider the effect on the upstream traffic of adding climbing lanes (i.e., two-lane facilities on direct connectors should be considered when a one-lane facility would significantly reduce the LOS).
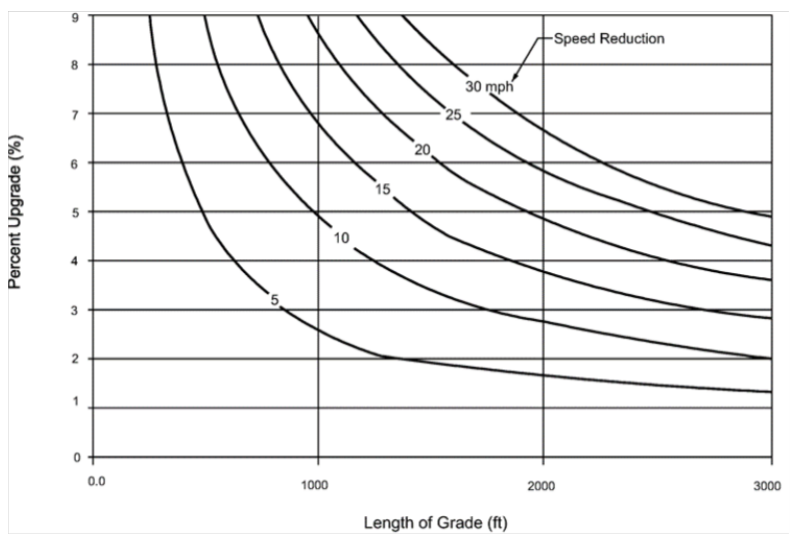
Figure 4-4: Critical Lengths of Grade for Design, Assumed Typical Heavy Truck of 200-lb/hp, Entering Speed = 70 mph
Source: AASHTO A Policy on Geometric Design of Highways and Streets
Functional Classification | Type of Terrain | Design Speed (mph) | |||||||||||||
15 | 20 | 25 | 30 | 35 | 40 | 45 | 50 | 55 | 60 | 65 | 70 | 75 | 80 | ||
Rural Town, Suburban, Urban and Urban Core | |||||||||||||||
Local 1 | All | 8 | 8 | 8 | 8 | 8 | 8 | 8 | |||||||
Collector 3 | Level | 9 | 9 | 9 | 9 | 9 | 9 | 8 | 7 | 7 | 6 | ||||
Rolling | 12 | 12 | 12 | 11 | 10 | 10 | 9 | 8 | 8 | 7 | |||||
Arterial 3 | Level | 8 | 7 | 7 | 6 | 6 | 5 | 5 | |||||||
Rolling | 9 | 8 | 8 | 7 | 7 | 6 | 6 | ||||||||
Freeway 4 | Level | 4 | 4 | 3 | 3 | 3 | 3 | 3 | |||||||
Rolling | 5 | 5 | 4 | 4 | 4 | 4 | 4 | ||||||||
Rural | |||||||||||||||
Local | Level | 9 | 8 | 7 | 7 | 7 | 7 | 7 | 6 | 6 | 5 | ||||
Rolling | 12 | 11 | 11 | 10 | 10 | 10 | 9 | 8 | 7 | 6 | |||||
Collector 3 | Level | 7 | 7 | 7 | 7 | 7 | 7 | 6 | 6 | 5 | |||||
Rolling | 10 | 10 | 9 | 9 | 8 | 8 | 7 | 7 | 6 | ||||||
Arterial | Level | 5 | 5 | 4 | 4 | 3 | 3 | 3 | 3 | 3 | |||||
Rolling | 6 | 6 | 5 | 5 | 4 | 4 | 4 | 4 | 4 | ||||||
Freeway 4 | Level | 4 | 4 | 3 | 3 | 3 | 3 | 3 | |||||||
Rolling | 5 | 5 | 4 | 4 | 4 | 4 | 4 | ||||||||
Notes: | |||||||||||||||
| |||||||||||||||
summarizes the maximum grade controls in terms of design speed. See
for defining level, rolling, and mountainous terrain conditions. Generally, the
maximum design grade should be used infrequently rather than as a value to be used in most cases.
However, for certain cases such as urban freeways, a maximum value may be applied in blanket fashion on interchange and grade separated approaches.Flat or level grades on uncurbed pavements are satisfactory when the pavement is adequately crowned to drain the surface water laterally and superelevation transitions are not co-located (see
).
When roadside ditches are required and follow the grade of the roadway, the roadway profile grade should seldom be less than 0.5 percent for unpaved ditches and 0.25 percent for lined channels.
When these roadway profile grade conditions are not met, special ditch profiles, independent of the roadway profile may be required to ensure positive ditch drainage.
For curbed pavements, a minimum roadway profile grade of 0.3 percent should be provided to facilitate surface drainage.
Joint analyses of rainfall frequency and duration, longitudinal grade, cross slope, curb inlet type, and spacing of inlets or discharge points are usually required so the width of water on the pavement surface during likely storms does not unduly interfere with traffic. Criteria for water ponding for various functionally classified roadways are contained in TxDOT’s
.4.8.2 Vertical Curves
Vertical curves provide gradual changes between tangents of different grades. The simple parabola shown in
is used in the highway profile design of vertical curves.
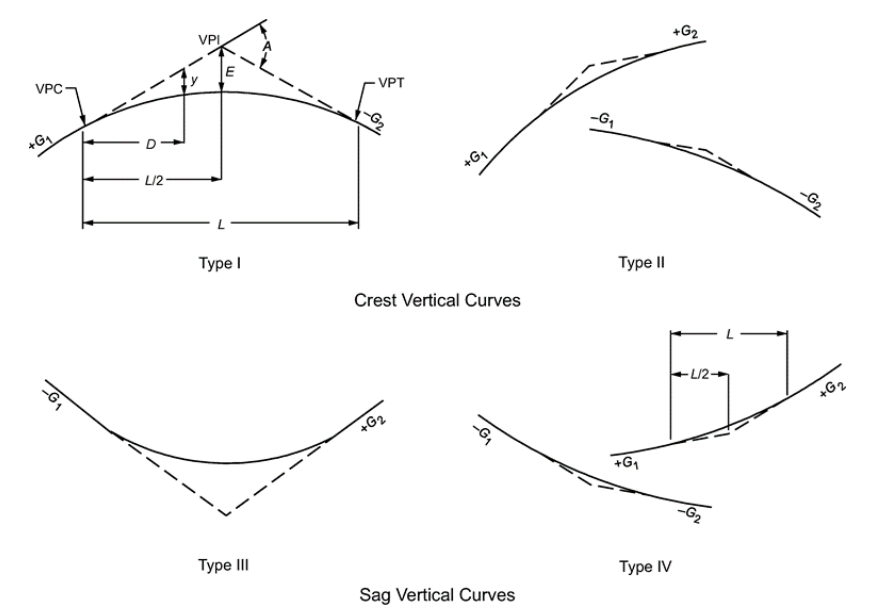
Figure 4-5: Types of Vertical Curves
Source: AASHTO A Policy on Geometric Design of Highways and Streets
For vertical curve discussion purposes, the following parameters are defined:
or
Where:
G
and 1
G
tangent grades, percent 2
=K =
length of vertical curve per percent change in A (also known as the design control)A =
algebraic difference in grades (G1
– G2
), percent L =
length of vertical curve, ft E =
vertical offset at the VPI, ft y =
ordinate from tangent to curve, ft D =
distance from nearest VPC or VPT to any point on curve, ftThe minimum lengths of crest and sag vertical curves for different values of A to provide the stopping sight distances for each design speed are shown in
and
, respectively. The solid lines give the minimum vertical curve lengths on the basis of rounded values of K. These lengths represent minimum K-values based on design speed.
A dashed curve crossing the solid lines indicates where sight distance (S) equals length of vertical curve (L) (i.e., S = L). Note that to the right of the S = L line, the value of K is a simple and convenient expression of the design control. For each design speed, this single value is a positive number that is indicative of the rate of vertical curvature. The design control in terms of K covers all combinations of
A and L for any one design speed; thus, A and L need not be indicated separately in a tabulation of the design values.
The selection of design curves is facilitated because the length of curve is equal to K times the algebraic difference in grades in percent, L = KA.
Conversely, the checking of curve design is simplified by comparing all curves with the design value for K.
Where S is greater than L, the values plot as a curve (as shown by the dashed curve extension for 45 mph). For small values of A, the vertical curve lengths are zero because the sight line passes over the apex. Since this relationship does not represent desirable design practice except in limited conditions (see discussion in
), a minimum length of vertical curve is shown. Attention should be given where there are successive vertical curves.
Preferable minimum lengths of vertical curves (both crest and sag) are three times the design speed.
L
min
= 3*DST
his minimum length is not considered a design control
(i.e., a design exception, design waiver would not be required for these minimum length values if the minimum stopping sight distance for the relevant design speed is met).For sag vertical curves, at least four different criteria for establishing the lengths of sag vertical curves are recognized to some extent. These are:
- Headlight sight distance;
- Passenger comfort;
- Drainage control; and
- General appearance.
Generally, a sag vertical curve should be long enough that the light beam distance is nearly the same as the stopping sight distance, especially at intersections located within the vicinity of the sag curve. Accordingly, it is appropriate to use stopping sight distances for different design speeds to establish sag vertical curve lengths. The resulting sag vertical curves for the recommended stopping sight distances for each design speed are shown in
with the solid lines representing the rounded K-values.
There is a level point on a vertical curve which can affect drainage, particularly on curbed facilities. This level point will only occur on Type I and Type III vertical curves shown in
. Typically, there is no difficulty with drainage on highways if the curve is sharp enough so that a minimum grade of 0.30 percent is reached at a point about 50-ft from the crest or sag. This corresponds to a K-value of 167 which is plotted in
and
as the drainage threshold. All combinations above or to the left of this line satisfy the drainage criterion. The combinations below and to the right of this line involve flatter vertical curves.
Special attention is needed in these cases to ensure proper pavement drainage.
It is not intended that these values be considered a design maximum, but merely a value beyond which drainage should be more carefully designed.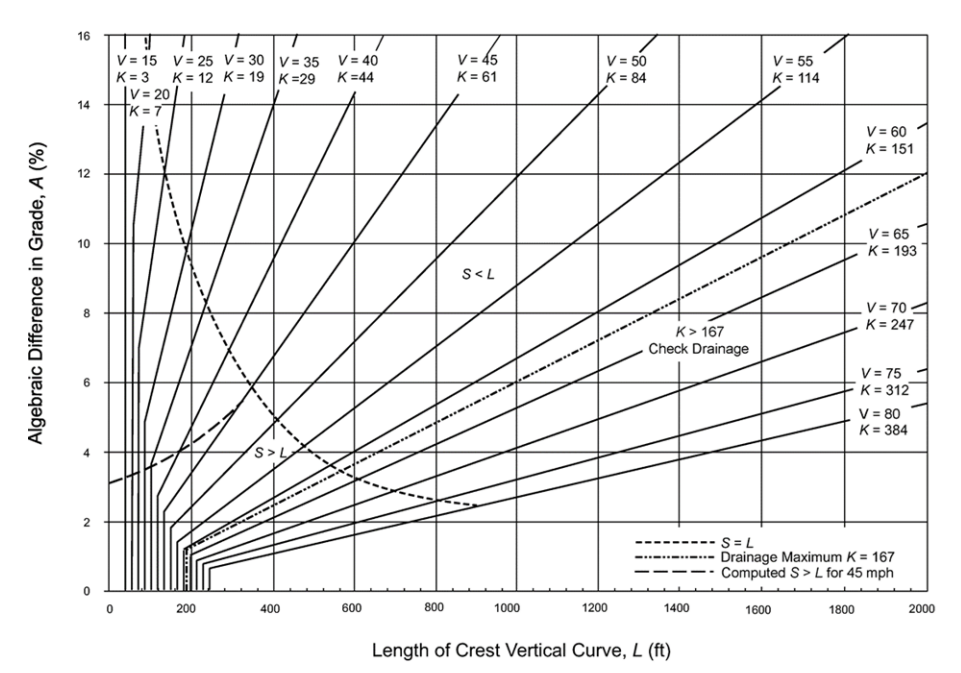
Figure 4-6: Design Controls for Crest Vertical Curves
Source: AASHTO A Policy on Geometric Design of Highways and Streets
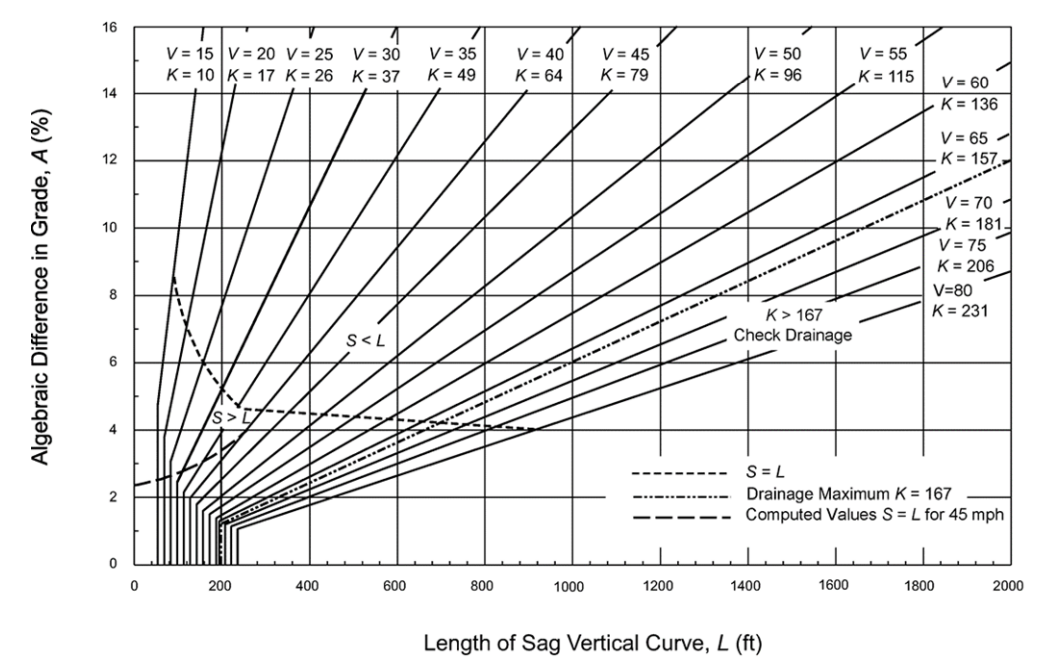
Figure 4-7: Design Controls for Sag Vertical Curves
Source: AASHTO A Policy on Geometric Design of Highways and Streets
provides minimum vertical curve lengths and associated K as a function of A.
Longer curves should be used wherever practical.
Design Speed (mph) | Crest Vertical Curves | Sag Vertical Curves | ||||
A (%) | Min K | Preferable Length of Curve 2 (ft) | A (%) | Min K | Preferable Length of Curve 2 (ft) | |
15 | ≥ 15.000 | 3 | - | > 4.500 | 10 | - |
< 15.000 | - | 45 | ≤ 4.500 | - | 45 | |
20 | ≥ 8.571 | 7 | - | > 3.529 | 17 | - |
< 8.571 | - | 60 | ≤ 3.529 | - | 60 | |
25 | ≥ 6.250 | 12 | - | > 2.884 | 26 | - |
< 6.250 | - | 75 | ≤ 2.884 | - | 75 | |
30 | ≥ 4.736 | 19 | - | > 2.432 | 37 | - |
< 4.736 | - | 90 | ≤ 2.432 | - | 90 | |
35 | ≥ 3.620 | 29 | - | > 2.142 | 49 | - |
< 3.620 | - | 105 | ≤ 2.142 | - | 105 | |
40 | ≥ 2.727 | 44 | - | > 1.875 | 64 | - |
< 2.727 | - | 120 | ≤ 1.875 | - | 120 | |
45 | ≥ 2.213 | 61 | - | > 1.708 | 79 | - |
< 2.213 | - | 135 | ≤ 1.708 | - | 135 | |
50 | ≥ 1.785 | 84 | - | > 1.562 | 96 | - |
< 1.785 | - | 150 | ≤ 1.562 | - | 150 | |
55 | ≥ 1.447 | 114 | - | > 1.434 | 115 | - |
< 1.447 | - | 165 | ≤ 1.434 | - | 165 | |
60 | ≥ 1.192 | 151 | - | > 1.323 | 136 | - |
< 1.192 | - | 180 | ≤ 1.323 | - | 180 | |
65 | ≥ 1.010 | 193 1 | - | > 1.242 | 157 | - |
< 1.010 | - | 195 | ≤ 1.242 | - | 195 | |
70 | ≥ 0.850 | 247 1 | - | > 1.160 | 181 1 | - |
< 0.850 | - | 210 | ≤ 1.160 | - | 210 | |
75 | ≥ 0.721 | 312 1 | - | > 1.092 | 206 1 | - |
< 0.721 | - | 225 | ≤ 1.092 | - | 225 | |
80 | ≥ 0.625 | 384 1 | - | > 1.038 | 231 1 | - |
< 0.625 | - | 240 | ≤ 1.038 | - | 240 | |
Notes: | ||||||
| ||||||
Because cost and energy conservation considerations are factors in operating continuous lighting systems, headlight sight distance should be generally used in the design of sag vertical curves.
“Comfort control criteria”
is approximately 50 percent of the sag vertical curve lengths required by headlight distance and should be reserved for special use. Instances where the comfort control criteria may be appropriately used include ramp profiles where safety lighting is provided and for economic reasons in cases where an existing element, such as a structure not ready for replacement, controls the vertical profile. Comfort control criteria should be used sparingly on continuously lighted facilities since local, outside agencies often maintain and operate these systems and operations could be curtailed in the event of energy shortages.A design waiver is not required if the sag vertical curve length meets comfort control criteria and lighting is provided.
See
for more information about sag vertical curve design to ensure that overhead sight obstructions such as structures for overpassing roadways, overhead sign bridges, and tree crowns do not reduce stopping sight distance below the appropriate minimum value.
When vertical curves are located within the limits of a bridge, it is preferred to locate the VPI, VPC, VPT’s in the center of the bridge abutment(s) or bent(s) to simplify construction.
4.8.3 Grade Change without Vertical Curves
Roadway profiles should be designed using vertical curves at vertical points of intersection and intersecting streets where practical. Designing a sag or crest vertical point of intersection without a vertical curve is generally acceptable where the grade difference (A) is:
- 1 percent or less for design speeds less than or equal to 45 mph; and
- 0.5 percent or less for design speeds greater than 45 mph.
When a grade change without vertical curve is specified, the construction process typically results in a short vertical curve being built (i.e., the actual point of intersection is “smoothed” in the field). It is recommended to always use vertical curves to address grade changes for the following conditions.
- Free flow intersections (without stop or yield control);
- Bridges (including bridge ends);
- Direct-traffic culverts; and
- Other locations requiring carefully detailed grades.
The minor approach (the approach with the lower ADT) of an intersection with yield or stop control may be constructed without vertical curves, provided that a grade change does not adversely affect local vehicle operations. A review of local traffic characteristics should be performed to identify a target design vehicle for each intersection for determining an appropriate grade change without a vertical curve. Typically, a grade change of 3 percent or less accommodates most vehicles. However, in highly constrained conditions, a grade change of up to 8 percent may operate effectively depending on local site conditions.
A design waiver or design exception will not be required if stopping sight distance is met for the minor approach of an intersection with yield or stop control.
Use of this criterion should be coordinated with the District Design Engineer prior to implementation and documented in the project files.
4.8.4 Vertical Alignment at Railroad Crossings
It is desirable that the intersection of highway and railroad be as level as possible from the standpoint of sight distance, rideability, and braking and acceleration distances. If a railroad crossing is located at the peak of a vertical curve on the highway, the curve should be adequately flat to avoid hanging-up of vehicles and of sufficient length to ensure an adequate view of the crossing consistent with the highway design or operating speed. Refer to TxDOT’s
(Chapter 7, Section 1) and
for additional information.
4.8.5 Vertical Alignment at Intersections
Adequate
intersection sight distance
should be provided at intersecting roads. At a minimum, stopping sight distance (measured from the edge of travel way of the intersecting facility) must be provided.
The grades of intersecting roads should be as level as practical.Approaching an intersection, drivers might misjudge the effect of steep grades on stopping or accelerating distances.
Approach grades steeper than 3 percent should be avoided within the stopping sight distance of the intersection. Where conditions make such designs impractical, grades should not exceed 6 percent.
At intersections where marked or unmarked crosswalks are present, the roadway profile grade within the crosswalks should be limited so that the crosswalk is accessible and usable by all individuals, including those with disabilities. The roadway profile grade across a crosswalk must not exceed:
- 2 percent for an intersection with stop or yield control; or
- Intersections with yield or stop control are those in which a vehicle must always slow or stop before proceeding through the intersection; for example, an intersection with a yield sign or stop sign.
- 5 percent for all other intersections.
- Intersections without yield or stop control are those in which a vehicle may proceed through the intersection without slowing or stopping; for example, an intersection with a traffic signal that has a green cycle phase, or an intersection without a yield sign or stop sign.
Accessibility accommodations should be considered when determining appropriate profile grades for all future crosswalk locations. See
for additional guidance and when TDLR variances are required.
It is generally preferable to provide a smooth junction at intersecting streets. To accomplish this, the profile, cross slopes, and crowns of both roads are warped to create a common plane at the intersection. This technique is commonly referred to as
“table-topping.”
Design features including but not limited to proper drainage and pedestrian use should be carefully considered when table-topping an intersection.When table-topping of an intersection is not feasible and minor roadway traffic is expected to stop or travel slowly through the intersection, grades should generally favor the
major roadway
(the roadway with the higher ADT) to provide a smooth profile. This is accomplished by warping the grades on the minor roadway to fit the cross-section of the major roadway. Similarly, for intersections contained within a horizontal curve with superelevation, an attempt should be made to match the superelevated section through the intersection.Additional profiling of intersection features (e.g., curb, median islands, and curb ramps) may be required to ensure proper drainage and a smooth intersection surface.
Contours at appropriate intervals (e.g., 1-ft major and 0.25-ft minor contours) and key curb elevations should be shown in the plans for proper construction of such intersections.
Low points near intersections must be designed to prevent water ponding within pedestrian access routes.A minimum pavement edge profile grade of 0.30 percent should be maintained along corner radii of curbed intersections.
The combination of vertical and horizontal alignment should allow adequate sight distance at an intersection. A sharp horizontal curve following a crest vertical curve is undesirable, particularly on intersection approaches.
4.8.6 Vertical Clearance
Minimum vertical clearance for structures should be calculated from the point on the roadway with least clearance including the outside edge of one shoulder to the other. This includes both sides of the structure being passed under to verify all vehicles can clear the structure at any point along the structure including travel lanes and shoulders.
Required vertical clearances also allow for potential future overlays.
shows the minimum vertical clearances required.
provides additional guidance for roadways on the THFN.See
for additional information on vertical clearance design exceptions, and THFN design deviations.
During construction, refer to TxDOT’s
for requirements on maximum time between erection of girders and placement of deck for spans overactive lanes of traffic to avoid over-height impacts.
At a minimum, during construction, bridge vertical clearances and all other obstructions above traffic, including temporary works, must be 14.5-ft.
A clearance of 15-ft is preferable to provide a sufficient buffer between allowed and actual heights to avoid over-height impacts.
Functional Classification | Vehicle Overpasses 2 (ft) | Overhead Sign Structures and Bicycle / Pedestrian Overpasses 4 (ft) |
Local/Collector/Arterial | 16.5 3 | 17.5 |
Freeway | 16.5 | 17.5 |
Texas Highway Freight Network (THFN) 5 | 18.5 | 19.5 |
Notes: | ||
| ||