4.8.2 Vertical Curves
Vertical curves provide gradual changes between tangents of different grades. The simple parabola shown in
is used in the highway profile design of vertical curves.
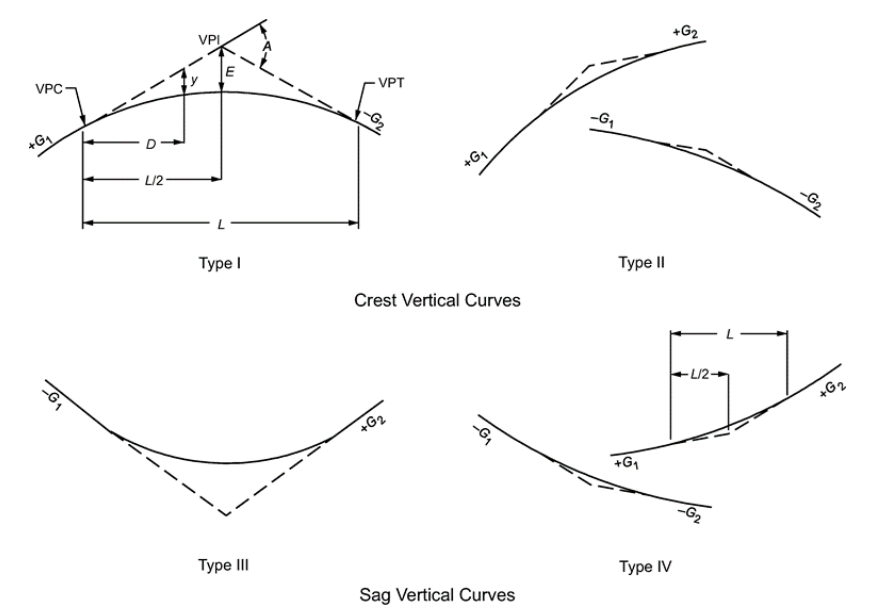
Figure 4-5: Types of Vertical Curves
Source: AASHTO A Policy on Geometric Design of Highways and Streets
For vertical curve discussion purposes, the following parameters are defined:
or
Where:
G
and 1
G
tangent grades, percent 2
=K =
length of vertical curve per percent change in A (also known as the design control)A =
algebraic difference in grades (G1
– G2
), percent L =
length of vertical curve, ft E =
vertical offset at the VPI, ft y =
ordinate from tangent to curve, ft D =
distance from nearest VPC or VPT to any point on curve, ftThe minimum lengths of crest and sag vertical curves for different values of A to provide the stopping sight distances for each design speed are shown in
and
, respectively. The solid lines give the minimum vertical curve lengths on the basis of rounded values of K. These lengths represent minimum K-values based on design speed.
A dashed curve crossing the solid lines indicates where sight distance (S) equals length of vertical curve (L) (i.e., S = L). Note that to the right of the S = L line, the value of K is a simple and convenient expression of the design control. For each design speed, this single value is a positive number that is indicative of the rate of vertical curvature. The design control in terms of K covers all combinations of
A and L for any one design speed; thus, A and L need not be indicated separately in a tabulation of the design values.
The selection of design curves is facilitated because the length of curve is equal to K times the algebraic difference in grades in percent, L = KA.
Conversely, the checking of curve design is simplified by comparing all curves with the design value for K.
Where S is greater than L, the values plot as a curve (as shown by the dashed curve extension for 45 mph). For small values of A, the vertical curve lengths are zero because the sight line passes over the apex. Since this relationship does not represent desirable design practice except in limited conditions (see discussion in
), a minimum length of vertical curve is shown. Attention should be given where there are successive vertical curves.
Preferable minimum lengths of vertical curves (both crest and sag) are three times the design speed.
L
min
= 3*DST
his minimum length is not considered a design control
(i.e., a design exception, design waiver would not be required for these minimum length values if the minimum stopping sight distance for the relevant design speed is met).For sag vertical curves, at least four different criteria for establishing the lengths of sag vertical curves are recognized to some extent. These are:
- Headlight sight distance;
- Passenger comfort;
- Drainage control; and
- General appearance.
Generally, a sag vertical curve should be long enough that the light beam distance is nearly the same as the stopping sight distance, especially at intersections located within the vicinity of the sag curve. Accordingly, it is appropriate to use stopping sight distances for different design speeds to establish sag vertical curve lengths. The resulting sag vertical curves for the recommended stopping sight distances for each design speed are shown in
with the solid lines representing the rounded K-values.
There is a level point on a vertical curve which can affect drainage, particularly on curbed facilities. This level point will only occur on Type I and Type III vertical curves shown in
. Typically, there is no difficulty with drainage on highways if the curve is sharp enough so that a minimum grade of 0.30 percent is reached at a point about 50-ft from the crest or sag. This corresponds to a K-value of 167 which is plotted in
and
as the drainage threshold. All combinations above or to the left of this line satisfy the drainage criterion. The combinations below and to the right of this line involve flatter vertical curves.
Special attention is needed in these cases to ensure proper pavement drainage.
It is not intended that these values be considered a design maximum, but merely a value beyond which drainage should be more carefully designed.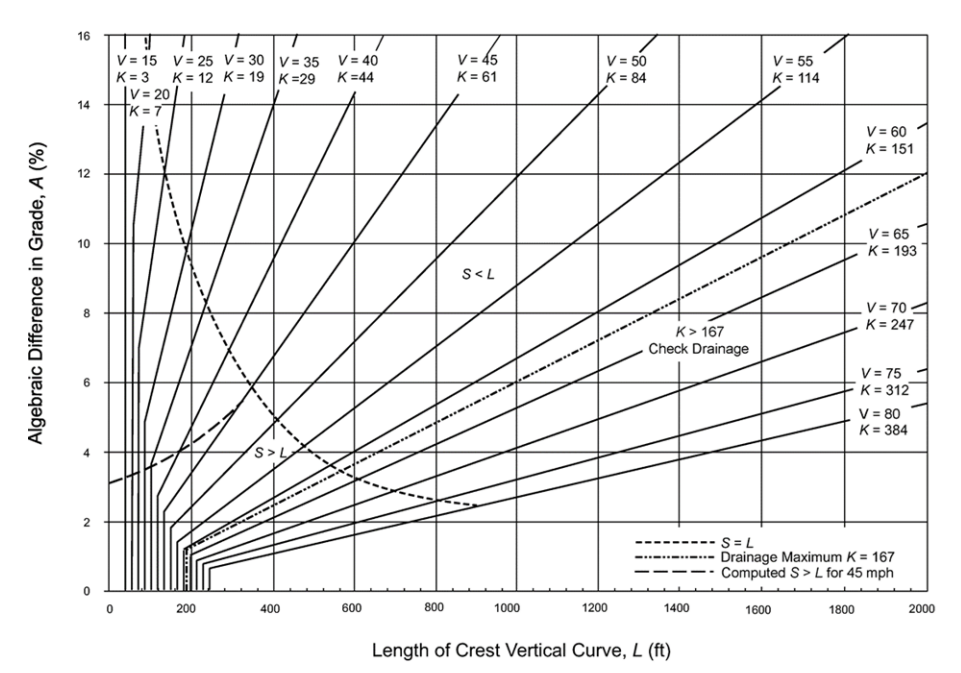
Figure 4-6: Design Controls for Crest Vertical Curves
Source: AASHTO A Policy on Geometric Design of Highways and Streets
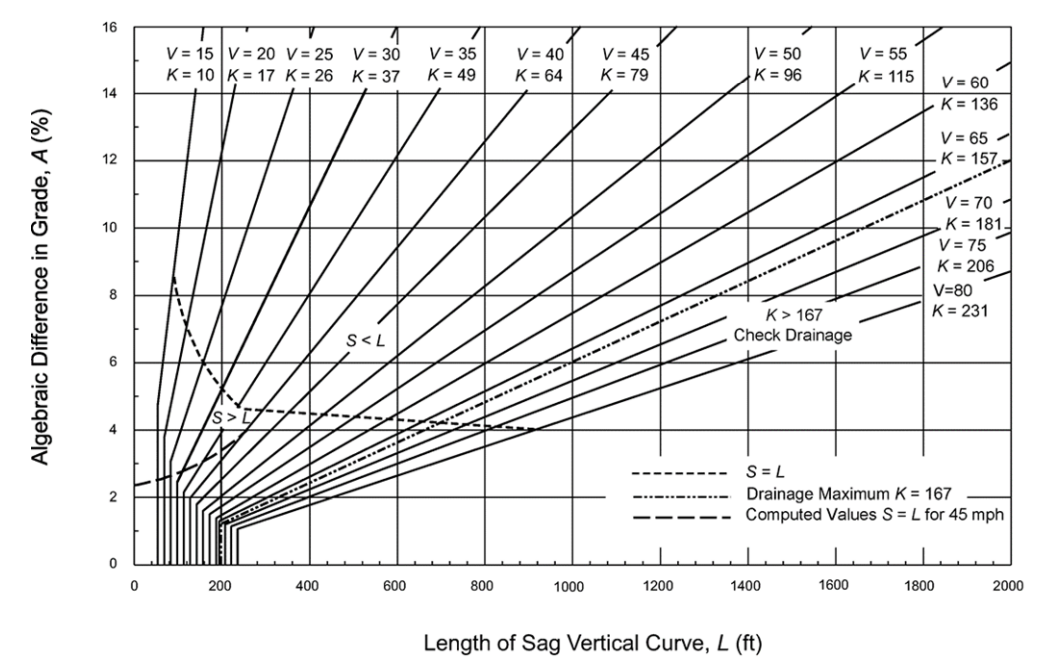
Figure 4-7: Design Controls for Sag Vertical Curves
Source: AASHTO A Policy on Geometric Design of Highways and Streets
provides minimum vertical curve lengths and associated K as a function of A.
Longer curves should be used wherever practical.
Design Speed (mph) | Crest Vertical Curves | Sag Vertical Curves | ||||
A (%) | Min K | Preferable Length of Curve 2 (ft) | A (%) | Min K | Preferable Length of Curve 2 (ft) | |
15 | ≥ 15.000 | 3 | - | > 4.500 | 10 | - |
< 15.000 | - | 45 | ≤ 4.500 | - | 45 | |
20 | ≥ 8.571 | 7 | - | > 3.529 | 17 | - |
< 8.571 | - | 60 | ≤ 3.529 | - | 60 | |
25 | ≥ 6.250 | 12 | - | > 2.884 | 26 | - |
< 6.250 | - | 75 | ≤ 2.884 | - | 75 | |
30 | ≥ 4.736 | 19 | - | > 2.432 | 37 | - |
< 4.736 | - | 90 | ≤ 2.432 | - | 90 | |
35 | ≥ 3.620 | 29 | - | > 2.142 | 49 | - |
< 3.620 | - | 105 | ≤ 2.142 | - | 105 | |
40 | ≥ 2.727 | 44 | - | > 1.875 | 64 | - |
< 2.727 | - | 120 | ≤ 1.875 | - | 120 | |
45 | ≥ 2.213 | 61 | - | > 1.708 | 79 | - |
< 2.213 | - | 135 | ≤ 1.708 | - | 135 | |
50 | ≥ 1.785 | 84 | - | > 1.562 | 96 | - |
< 1.785 | - | 150 | ≤ 1.562 | - | 150 | |
55 | ≥ 1.447 | 114 | - | > 1.434 | 115 | - |
< 1.447 | - | 165 | ≤ 1.434 | - | 165 | |
60 | ≥ 1.192 | 151 | - | > 1.323 | 136 | - |
< 1.192 | - | 180 | ≤ 1.323 | - | 180 | |
65 | ≥ 1.010 | 193 1 | - | > 1.242 | 157 | - |
< 1.010 | - | 195 | ≤ 1.242 | - | 195 | |
70 | ≥ 0.850 | 247 1 | - | > 1.160 | 181 1 | - |
< 0.850 | - | 210 | ≤ 1.160 | - | 210 | |
75 | ≥ 0.721 | 312 1 | - | > 1.092 | 206 1 | - |
< 0.721 | - | 225 | ≤ 1.092 | - | 225 | |
80 | ≥ 0.625 | 384 1 | - | > 1.038 | 231 1 | - |
< 0.625 | - | 240 | ≤ 1.038 | - | 240 | |
Notes: | ||||||
| ||||||
Because cost and energy conservation considerations are factors in operating continuous lighting systems, headlight sight distance should be generally used in the design of sag vertical curves.
“Comfort control criteria”
is approximately 50 percent of the sag vertical curve lengths required by headlight distance and should be reserved for special use. Instances where the comfort control criteria may be appropriately used include ramp profiles where safety lighting is provided and for economic reasons in cases where an existing element, such as a structure not ready for replacement, controls the vertical profile. Comfort control criteria should be used sparingly on continuously lighted facilities since local, outside agencies often maintain and operate these systems and operations could be curtailed in the event of energy shortages.A design waiver is not required if the sag vertical curve length meets comfort control criteria and lighting is provided.
See
for more information about sag vertical curve design to ensure that overhead sight obstructions such as structures for overpassing roadways, overhead sign bridges, and tree crowns do not reduce stopping sight distance below the appropriate minimum value.
When vertical curves are located within the limits of a bridge, it is preferred to locate the VPI, VPC, VPT’s in the center of the bridge abutment(s) or bent(s) to simplify construction.