11.3 Interchange Configuration Evaluation (ICE)
11.3.1 Process Overview and Reporting
The two-stage ICE study procedure is beneficial for interchange modification, reconstruction or where new construction n is planned.
In Stage 1 the intersection analysis is comprised of operations and safety components:
- Operational analysis using CAP-X and traffic signal warrants per the TMUTCD warrants.
- SPICE
See
Chapter 10
for process and data requirements. Appendix L, Section 1 – Interchange Analysis Checklist
provides two sample checklists of data required and information to be reported for ICE type studies. Other interchange studies may require a more detailed gathering of information, per Appendix L, Section 1 -Interchange Analysis Checklist – Other Studies.
CAP-X is a pass-fail tool and not a ranking tool. The CAP-X LOS results are not granular enough to rank alternatives. SPICE, in Stage 1, can be used as a ranking tool. Stage 2 ICE includes more advanced safety and operations analysis as needed, along with other factors such as cost and impacts (utilities, ROW, environmental, etc.), as needed. The main tools used in Stage 2 operations analysis are Synchro, HCS, and Vissim. The analysis software tool selection is based on intersection type, project complexity, and object level of detail. See for recommended analysis tools. The capability of the software is found in
Chapter 4
. Stage 2 Safety analysis and detailed comparison of alternatives uses the FHWA Interchange Safety Comparison Tool (see Appendix L, Section 4
).When both the safety (SPICE) and operations (CAP-X) analyses generate a clear preference for intersection control, Stage 2 ICE investigation may not be necessary and the project can proceed to schematic design and detailed cost estimation. ICE Stage 2 is necessary when a clear preference for safety improvement is not evident in Stage 1, or where more detailed operational or impacts analysis is needed.
11.3.2 Stage 1 Operational Performance and ICE
CAP-X is a Stage 1 ICE spreadsheet-based tool that compares anticipated v/c ratios of various interchange and ramp terminus types. CAP-X analysis determines the interchange type that will provide the most capacity given a set of inputs. CAP-X analyzes multiple intersection types. CAP-X covers initial screening of the following types of interchanges:
- Diamond;
- Partial cloverleaf A and B;
- Displaced left-turn;
- Contraflow left;
- DDI;
- SPUI; and
- Single-point roundabout
CAP-X screens most types of interchanges except for the double roundabout interchange. CAP-X is typically used for initial screening of interchanges, but not for ranking alternatives – just a pass/fail indication. Any additional analysis on interchanges is done in HCM-based (mesoscopic), deterministic, or microsimulation (microscopic) tools. An example output of CAP-X is shown in
Appendix K, Section 4 – Sample Output
.11.3.3 Stage 1 Safety Performance and ICE
The Stage 1 SPICE Tool aids in determining a preferred alternative for a given ramp terminal intersection type by providing an objective, quantifiable basis to compare the safety performance of different ramp terminal intersection types.
Appendix L, Section 4
provides a link to acquire the SPICE spreadsheet tool. Where ramp terminal intersections are being compared, the tool provides for both ramp terminal intersections to be analyzed and the results combined for the entire interchange. The tool automates the SPF and CMF selection process. The types of ramp terminal intersection control strategies that can be analyzed include a conventional traffic signal, a crossover traffic signal of a DDI, or stop control on the ramps. As of 2024, SPFs or CMFs are not available for roundabout ramp-terminal intersections. Use the stand-alone roundabout intersection and run it for each ramp terminal, as a suitable substitute until SPICE is updated.
11.3.4 Stage 2 Operational Performance and ICE
At this stage, safety and operations for the short list of alternative interchange configurations are analyzed in more detail. The main tools used in intersection operational analysis are Synchro, HCS, and Vissim. ETT and the effects of varying origin and destination patterns can be accounted for using the methods described in the next sections. The analysis software tool selection is based on ramp intersection type, project complexity, and object level of detail (see ). Information related to the capabilities of the software is found in
Chapter 4
.11.3.4.1 Operational Analysis Using Experienced Travel Time (ETT)
LOS for interchanges is based on a combination of guidelines provided in the HCM 7th Edition for isolated intersections and urban segments. Because most interchanges are made up of clustered intersections, each user experiences both control delay at each signalized or unsignalized intersection and extra travel time due to the longer distances between intersections. ETT is a way to measure delay at interchanges, introduced in the HCM. ETT measures both control delay and travel time delay.
Appendix L, Section 4
provides ETT computational aids for several alternative intersections and interchanges through the FHWA Techbrief: Publication No.: FHWA-HRT16-069.The LOS for interchanges is measured in terms of ETT. Computing ETTs makes it possible to compare operations between standard and alternative interchanges that depend on diverted movements and multiple decision points. ETT is the sum of control delay at every junction and the extra distance travel time (EDTT) through the interchange, as shown below: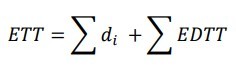
ETT = Experienced Travel Time (sec)
d
i
= control delay (sec) at every junction i encountered by the driver from origin to destination.EDTT (sec) due to the extra distance necessary to travel between the individual intersections of the interchange.
An ETT calculation example of capturing ETT for one movement going from point A to point D at a conventional diamond interchange is shown in . The ETT is equal to the control delay of the eastbound left movement at intersection 1 and the control delay of the northbound through movement at intersection 2, plus any EDTT. The EDTT for this movement would be equal to the difference in travel time between the indirect left-turn maneuver and a direct 90-degree left-turn movement from the eastbound approach to the northbound approach.
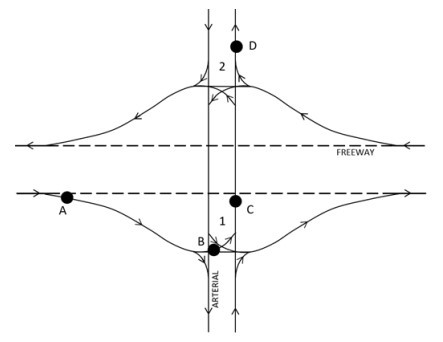
Figure 11-14: Experienced Travel Time at Diamond Interchange
The following equation is applied to calculate the ETT for the movement between points A and D:
ETT
AD
= dELB1
+ dNBT2
+ EDTTAD
= d
ELB1
+ dNBT2
+ (TTABC
- TTAC
)Where:
ETT
AD
= Experienced Travel Time from A to Dd
ELB1
= Eastbound left control delay at first pointd
NBT2
= Northbound through control delay at second pointEDTT
AD
= Extra distance travel time between A and DTT
ABC
= Travel time along path A-B-CTT
AC
= Travel time along (hypothetical) path A-C11.3.4.2 O-D and Turning Movements
Each turning movement (left, through, right, Uturn) of each approach of an interchange has an origin point at the approach leg and a destination point at the departure leg. Each OD pair experiences delay as it travels through the interchange. The sum of these delays makes up the ETT. The LOS for each OD pair is based on the average ETT of the users completing that movement. from HCM 7th Edition, Chapter 34, presents a worksheet for converting turning movement volumes to/from OD movement volumes at a diamond (including DDI) interchange. HCM also includes similar worksheets for a partial cloverleaf interchange, a double roundabout interchange, and a SPUI (one input intersection). Once OD volumes are obtained, the performance of various interchange types can be compared. The worksheets accommodate up to the following number of OD movements:
16 OD movements for roundabout interchanges (turning left, through, right, or U-turn per approach on four approaches);
14 OD movements for diamond (including DDI) interchanges (turning left, though, or right per approach on four approaches and making a U-turn on the major road approaches);
12 OD movements for SPUIs (turning left, though, or right per approach on four approaches); and
12 OD movements for partial cloverleaf interchanges (turning left, right, or U-turn on major road approaches and turning left, though, or right on minor road approaches)
Input | Output | |||||
|---|---|---|---|---|---|---|
Approach | Intersection I | Intersection II | OD Movement Calculation | Volume (veh/h) | ||
Turning Movement | Volume | Turning Movement | Volume | |||
(veh/h) | (veh/h) | |||||
Eastbound (EB) | LT | INT-LT | A = (NB LT) – (NB UT) | |||
EXT-RT | RT | B = NB RT | ||||
EXT-TH | INT-TH | C = SB RT | ||||
Westbound (WB) | INT-LT | LT | D = (SB LT) – (SB UT) | |||
RT | EXT-RT | E = (EB INTLT) – (SB UT) | ||||
INT-TH | EXT-TH | F = EB EXTRT | ||||
Northbound (NB) | LT | LT | G = WB EXTRT | |||
RT | RT | H = (WB INTLT) – (NB UT) | ||||
TH | TH | I = (EB INTTH) – (SB LT) + (SB UT) | ||||
UT | UT | J = (WB INTTH) – (NB LT) + (NB UT) | ||||
Southbound (SB) | LT | LT | K = NB TH | |||
RT | RT | L = SB TH | ||||
TH | TH | M = NB UT | ||||
UT | UT | N = SB UT | ||||
Note: LT=left turn, RT=right turn, UT=U-turn, TH=through, INT=internal, EXT=external. The flows of the two U-turn movements from the freeway (NB UT and SB UT) are user-specified. Shading indicates movements that do not occur in this interchange form. | ||||||
11.3.4.3 LOS Guidelines
Roundabout interchanges and signalized interchanges have separate LOS thresholds. LOS is typically found for each OD movement through the interchange rather than individual turning movements occurring at the different intersections. shows the delay-based LOS criteria for signalized interchanges for each OD pair. LOS is defined as F for any OD pair or lane group that exceeds a volume-to-capacity (v/c) ratio or queue-to-storage ratio of 1.0
ETT (s/veh) | LOS |
|---|---|
≤15 | A |
>15-30 | B |
>30-55 | C |
>55-85 | D |
>85-120 | E |
>120 | F (v/c > 1) |
shows the delay-based LOS criteria for roundabout interchanges for each OD pair. The LOS criterion is the same regardless of whether the interchange is a single or double roundabout
ETT (s/veh) | LOS |
|---|---|
≤15 | A |
>15-25 | B |
>25-35 | C |
>35-50 | D |
>50-75 | E |
>75 | F (v/c > 1) |
When evaluating interchanges using deterministic traffic analysis software, the software does not provide ETT as an output. In those instances, manual (spreadsheet) calculation of ETT can be performed based on the outputs provided by the software. If manual calculation is not possible, it is acceptable to report intersection LOS for each intersection of the interchange. However, ETT results are recommended to be reported when analyzing interchanges in Microsimulation (microscopic) analysis software or HCS. Microsimulation (microscopic) analysis is often used for complex geometry, atypical conditions, and oversaturated conditions.
Additional information on LOS methodology for diamond, cloverleaf, diverging diamond, single-point urban, and roundabout interchanges is covered in Chapter 23 (methodology) of the HCM 7th Edition. Chapter 34 (applications) of HCM 7th Edition provides guidance on selecting an interchange type based on operational performance. The LOS methodology does not cover interchanges with two-way stopcontrolled intersections, interchanges consisting of both roundabout and signalized intersections, or freeway-to-freeway interchanges. Chapter 38 of the HCM presents methodologies for corridors involving freeways and surface streets, including queue spillback. Microsimulation (microscopic) analysis is typically used to analyze the impact of queuing.
When calculating LOS for signalized diamond interchanges, it is recommended that coordination with adjacent arterial signalized intersections be considered, along with optimized timing and the appropriate diamond timing sequence for traffic patterns present or projected.
11.3.5 Data Input and Parameters
The general inputs needed to perform traffic operational and safety analysis for interchanges are below.
- Peak hour TMC for all the approaches;
- Distance between intersections of an interchange;
- Number of lanes and lane assignment;
- Heavy vehicle percentages;
- Turning movement speeds and speed limits;
- Pedestrian/bicyclist volumes;
- Number of lanes crossed by a pedestrian/bicyclist;
- Crash records for the preceding three to five years; and
- OD information to discount U-turn movements or properly account for the depending on configuration
11.3.6 Additional Operational Analysis
Many tools are available to perform traffic operational analysis. Depending on the type of analysis and level of detail necessary, different tools are needed. below summarizes the overall tool selection process based on interchange type and analysis level of detail.
Appendix L, Section 1 – Interchange Analysis Checklist
can also be used to guide the operational analysis.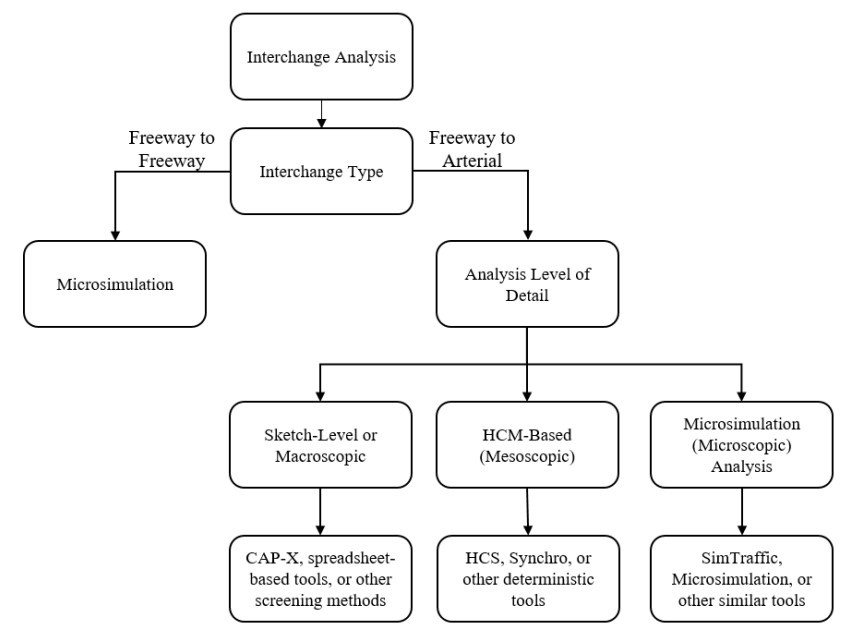
Figure 11-15: Traffic Operational Analysis Tool Selection Flow Chart for Interchanges
The most common tools used for traffic operational analysis for interchanges are HCS, Synchro, and Vissim. A summary of the capabilities of the tools, how the tools can be used, and their limitations is below.
11.3.6.1 HCS
HCS is an HCM-based (mesoscopic) tool that allows for evaluation of several types of interchanges. HCS covers the following interchange types:
- Diamond (stop control, signals, or roundabouts);
- Partial cloverleaf A and B;
- DDI; and
- SPUI (Signals or roundabout)
HCS outputs include traffic operations MOEs (e.g., LOS, delay, queue lengths) and ETT.
HCS is one of the only tools that directly reports ETT. It is important to note that HCS cannot be used to evaluate oversaturated conditions
, particularly when there is queue spillback affecting upstream and downstream operations. Other limitations of HCS include analyzing impacts of interchange operations on the arterial street, providing travel time for upstream and downstream links, and interchanges with two-way stop control junctions or combination of signalized and unsignalized junctions. It is recommended to use microsimulation (microscopic) tools in these scenarios.11.3.6.2 Synchro
Synchro is a deterministic tool that has capabilities for performing HCM-based (mesoscopic) analysis. Synchro evaluates all interchange types mentioned in
Section 11.2.1
. Synchro analyzes signalized and unsignalized intersection delay for HCM-based (mesoscopic) interchange types (see HCS discussion above). However, Synchro is limited in evaluating and properly reporting results for interchanges with complicated geometry. Results from single roundabout, double roundabout, displaced left turn, and contraflow left turn interchanges may need to be scrutinized further or validated by another tool to confirm the results are reasonable. Similar to HCS, Synchro is limited in evaluating oversaturated interchanges with queue spillbacks that might affect upstream and downstream operations. Unlike HCS, Synchro does not directly report ETT.11.3.6.3 Vissim
Vissim is a Microsimulation (microscopic) tool and can be used based on the project scope and complexity. Vissim evaluates all interchange types mentioned in
Section 11.2.1
. Because it is a Microsimulation (microscopic) software, Vissim evaluates oversaturated conditions well when compared to deterministic or HCM-based (mesoscopic) tools. However, Vissim analyses are typically data-intensive and demand more effort. Vissim does not capture real-world rerouting due to extreme congestion. Similar to other analysis tools, Vissim does not directly output ETT, but travel time routes can be set up in the network to account for ETT.11.3.7 Stage 2 Safety Performance and ICE
Stage 2 safety analysis and detailed comparison of alternatives uses the FHWA Interchange Safety Comparison Tool (see
Appendix L, Section 4
). This spreadsheet tool, developed through the FHWA’s Safety Comparison Between Interchange Types, combines the safety implications of pairs of ramp terminal intersections or overall interchange configuration. This spreadsheet implements the crash prediction models for diamond, tight diamond, roundabout diamond, diverging diamond, single-point diamond, tight diamond, and partial cloverleaf (parclo) interchanges.11.3.7.1 Conflict Points
Conflict points are a high-level, simple measure of the potential collision or crossing between two intersecting roadway configurations. Conflicts are created at points where users cross, diverge, or merge with another user. Crossing conflict points, which are points that show the crash potential of two opposing traffic streams, often result in higher severity collisions than merging and diverging conflict points, where vehicles are traveling in the same directions. presents the number of conflict points based on type of interchange, assuming a single lane in each direction. The number of conflict points vary depending on the number and configuration of lanes. A greater number of conflict points does not automatically result in more alarming operations. For example, although the DDI has more conflict points than a partial cloverleaf interchange, the conflict points are more spread out and so the overall relative exposure is comparable. A conflict points diagram for a single roundabout is shown as an example in
Interchange | Diverging | Merging | Crossing | Total |
|---|---|---|---|---|
Conventional Diamond | 8 | 8 | 10 | 26 |
Single-Point Urban | 8 | 8 | 8 | 24 |
Single Roundabout | 6 | 6 | 0 | 12 |
Conventional Double Roundabout | 8 | 8 | 0 | 16 |
Cloverleaf | 8 | 8 | 0 | 16 |
Diverging Diamond | 6 | 6 | 2 | 14 |
Partial Cloverleaf (Parclo) | 6 (Parclo A4) / 4 (Parclo B4) | 4 (Parclo A4) / 6 (Parclo B4) | 2 | 12 |
Sources: FHWA Signalized Intersections: Informational Guide, FHWA AIIR
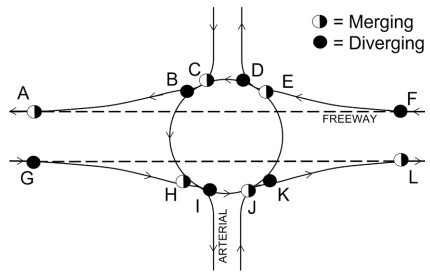
Figure 11-16: Single Roundabout Conflict Points
11.3.7.2 Historical Crash Analysis
A historical crash analysis is completed to identify the types of crashes occurring at an interchange. A crash analysis is typically completed for each separate intersection of an interchange. See
Chapter 6
in this manual and Chapter 9 in the HSM for information on the data needed to complete a historical crash analysis, how to calculate an intersection crash rate, and how to create a collision diagram. The HSM tools described in more detail below can also be used to estimate the safety performance of an existing interchange. The
ISATe
is useful for safety assessment of ramp terminals. It provides information about the relationship between roadway geometric design features and safety. This analysis uses design data, traffic control data, cross section data, and up to five years of crash data. The ISATe tool outputs include expected number of crashes for the study period and CMFs related to different geometric design features. It does not account for safety prediction of a frontage road ramp terminal and for roundabouts, nor SPUI’s. Appendix L, Section 4
provides a reference to access this safety prediction tool. The
IHSDM
can also be used to predict crash frequencies at ramp terminal intersections and compare safety effects of different geometric design features. Roundabouts at freeway ramp terminals can also be evaluated. The tool outputs predicted average crash frequencies for total and fatal/injury crashes. Appendix L, Section 4
provides a reference to access this safety prediction tool. Additional information related the HSM predictive method, SPFs, CMFs, SPICE, and IHSDM are provided in greater detail in
Chapter 5 and Chapter 6
of this manual and additional references are listed in Appendix L, Section 4.
11.3.7.3 Pedestrian and Bicycle Considerations
As of 2024, pedestrian and bicycle LOS for interchanges is not included in the HCM 7th Edition. Pedestrian control delay can be evaluated at individual signalized intersections, and pedestrian crossing delay can be evaluated at unsignalized intersections. The quality of service of pedestrian and bicyclists along the arterial of an interchange can be approximated using HCM’s Urban Street
Facilities methodologies. CAP-X evaluates the level of pedestrian and bicycle accommodations at a few interchange types. Inputs include number of pedestrian crossings, number of lanes, and vehicle speeds at each crossing.
NCHRP 948: Guide for Pedestrian and Bicyclist Safety at Alternative and Other Intersections and Interchanges provides additional guidance on accommodating pedestrians and bicyclists at DDI. Refer to Chapter 14 for more information on multimodal accommodations and analysis.
11.3.8 Cost-Benefit Analysis
Another method of alternative analysis for interchanges is a cost-benefit analysis. This is typically done for all interchange analysis that demand analyzing multiple interchanges to select the preferred alternative. All costs associated with an interchange are accounted for and compared when performing a cost-benefit analysis:
- OPCC Perform rough order of magnitude costs;
- Review similar completed projects for an approximation;
- Include costs for ROW acquisition, utility relocations, and environmental impacts due to construction;
- Life Cycle Cost;
- Compares interchange control costs, including construction, maintenance, and operational costs;
- NCHRP’s Life-Cycle Cost Estimation Tool (seeAppendix L, Section 4);
- For cost parameters, use TxDOT’s Road User Costs and the NSC’s average economic costs per injury severity; and
- For crash prediction estimates use FHWA’s Interchange Comparison Safety Tool, User Guide, 2023. This tool implements the crash prediction models for diamond, compressed diamond, roundabout diamond, diverging diamond, single-point diamond, tight diamond, and partial cloverleaf (parclo) interchanges (seeAppendix L, Section 4).
Weigh each cost in relation to its importance to the overall project purpose when comparing alternatives. Collect additional data if needed.
11.3.9 Other Considerations (Impacts)
An alternative may address the intersection needs from an operational and safety perspective, but several other considerations may determine whether it is a practical option to pursue. These include the following:
- ROW, environmental impacts, and construction costs;
- Constructability timelines, staging, temporary traffic control needs, and project delivery;
- Acceptability of the alternative by the public, local jurisdictions, and other important stakeholders; and
- Consistency within interregional corridors or other highways where a corridor study has been prepared.
The suitability of each interchange alternative for pedestrians and bicyclists should be assessed with an emphasis on convenience and accessibility and consideration of pedestrian and bicyclist network information from local and community plans. Potential items to consider include number of lanes to cross, protected versus permitted turning movements, and motorist approach speeds. Additionally, the multimodal assessment should consider the suitability of each alternative for transit, freight, and other large vehicle operations when applicable. The Stage I scoping analysis with respect to freight and other large vehicle operation can be informed by whether an intersection is part of a designated Truck Route or Over-Size-Over-Weight Route. Transit assessments can be informed by discussions with the transit provider about different treatment options and any operating restrictions associated with different intersection and control types.