11.3.7 Stage 2 Safety Performance and ICE
Stage 2 safety analysis and detailed comparison of alternatives uses the FHWA Interchange Safety Comparison Tool (see
Appendix L, Section 4
). This spreadsheet tool, developed through the FHWA’s Safety Comparison Between Interchange Types, combines the safety implications of pairs of ramp terminal intersections or overall interchange configuration. This spreadsheet implements the crash prediction models for diamond, tight diamond, roundabout diamond, diverging diamond, single-point diamond, tight diamond, and partial cloverleaf (parclo) interchanges.11.3.7.1 Conflict Points
Conflict points are a high-level, simple measure of the potential collision or crossing between two intersecting roadway configurations. Conflicts are created at points where users cross, diverge, or merge with another user. Crossing conflict points, which are points that show the crash potential of two opposing traffic streams, often result in higher severity collisions than merging and diverging conflict points, where vehicles are traveling in the same directions. presents the number of conflict points based on type of interchange, assuming a single lane in each direction. The number of conflict points vary depending on the number and configuration of lanes. A greater number of conflict points does not automatically result in more alarming operations. For example, although the DDI has more conflict points than a partial cloverleaf interchange, the conflict points are more spread out and so the overall relative exposure is comparable. A conflict points diagram for a single roundabout is shown as an example in
Interchange | Diverging | Merging | Crossing | Total |
|---|---|---|---|---|
Conventional Diamond | 8 | 8 | 10 | 26 |
Single-Point Urban | 8 | 8 | 8 | 24 |
Single Roundabout | 6 | 6 | 0 | 12 |
Conventional Double Roundabout | 8 | 8 | 0 | 16 |
Cloverleaf | 8 | 8 | 0 | 16 |
Diverging Diamond | 6 | 6 | 2 | 14 |
Partial Cloverleaf (Parclo) | 6 (Parclo A4) / 4 (Parclo B4) | 4 (Parclo A4) / 6 (Parclo B4) | 2 | 12 |
Sources: FHWA Signalized Intersections: Informational Guide, FHWA AIIR
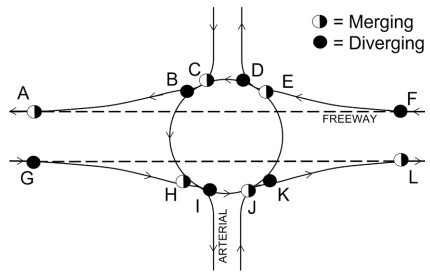
Figure 11-16: Single Roundabout Conflict Points
11.3.7.2 Historical Crash Analysis
A historical crash analysis is completed to identify the types of crashes occurring at an interchange. A crash analysis is typically completed for each separate intersection of an interchange. See
Chapter 6
in this manual and Chapter 9 in the HSM for information on the data needed to complete a historical crash analysis, how to calculate an intersection crash rate, and how to create a collision diagram. The HSM tools described in more detail below can also be used to estimate the safety performance of an existing interchange. The
ISATe
is useful for safety assessment of ramp terminals. It provides information about the relationship between roadway geometric design features and safety. This analysis uses design data, traffic control data, cross section data, and up to five years of crash data. The ISATe tool outputs include expected number of crashes for the study period and CMFs related to different geometric design features. It does not account for safety prediction of a frontage road ramp terminal and for roundabouts, nor SPUI’s. Appendix L, Section 4
provides a reference to access this safety prediction tool. The
IHSDM
can also be used to predict crash frequencies at ramp terminal intersections and compare safety effects of different geometric design features. Roundabouts at freeway ramp terminals can also be evaluated. The tool outputs predicted average crash frequencies for total and fatal/injury crashes. Appendix L, Section 4
provides a reference to access this safety prediction tool. Additional information related the HSM predictive method, SPFs, CMFs, SPICE, and IHSDM are provided in greater detail in
Chapter 5 and Chapter 6
of this manual and additional references are listed in Appendix L, Section 4.
11.3.7.3 Pedestrian and Bicycle Considerations
As of 2024, pedestrian and bicycle LOS for interchanges is not included in the HCM 7th Edition. Pedestrian control delay can be evaluated at individual signalized intersections, and pedestrian crossing delay can be evaluated at unsignalized intersections. The quality of service of pedestrian and bicyclists along the arterial of an interchange can be approximated using HCM’s Urban Street
Facilities methodologies. CAP-X evaluates the level of pedestrian and bicycle accommodations at a few interchange types. Inputs include number of pedestrian crossings, number of lanes, and vehicle speeds at each crossing.
NCHRP 948: Guide for Pedestrian and Bicyclist Safety at Alternative and Other Intersections and Interchanges provides additional guidance on accommodating pedestrians and bicyclists at DDI. Refer to Chapter 14 for more information on multimodal accommodations and analysis.