11.3.4 Stage 2 Operational Performance and ICE
At this stage, safety and operations for the short list of alternative interchange configurations are analyzed in more detail. The main tools used in intersection operational analysis are Synchro, HCS, and Vissim. ETT and the effects of varying origin and destination patterns can be accounted for using the methods described in the next sections. The analysis software tool selection is based on ramp intersection type, project complexity, and object level of detail (see ). Information related to the capabilities of the software is found in
Chapter 4
.11.3.4.1 Operational Analysis Using Experienced Travel Time (ETT)
LOS for interchanges is based on a combination of guidelines provided in the HCM 7th Edition for isolated intersections and urban segments. Because most interchanges are made up of clustered intersections, each user experiences both control delay at each signalized or unsignalized intersection and extra travel time due to the longer distances between intersections. ETT is a way to measure delay at interchanges, introduced in the HCM. ETT measures both control delay and travel time delay.
Appendix L, Section 4
provides ETT computational aids for several alternative intersections and interchanges through the FHWA Techbrief: Publication No.: FHWA-HRT16-069.The LOS for interchanges is measured in terms of ETT. Computing ETTs makes it possible to compare operations between standard and alternative interchanges that depend on diverted movements and multiple decision points. ETT is the sum of control delay at every junction and the extra distance travel time (EDTT) through the interchange, as shown below: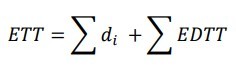
ETT = Experienced Travel Time (sec)
d
i
= control delay (sec) at every junction i encountered by the driver from origin to destination.EDTT (sec) due to the extra distance necessary to travel between the individual intersections of the interchange.
An ETT calculation example of capturing ETT for one movement going from point A to point D at a conventional diamond interchange is shown in . The ETT is equal to the control delay of the eastbound left movement at intersection 1 and the control delay of the northbound through movement at intersection 2, plus any EDTT. The EDTT for this movement would be equal to the difference in travel time between the indirect left-turn maneuver and a direct 90-degree left-turn movement from the eastbound approach to the northbound approach.
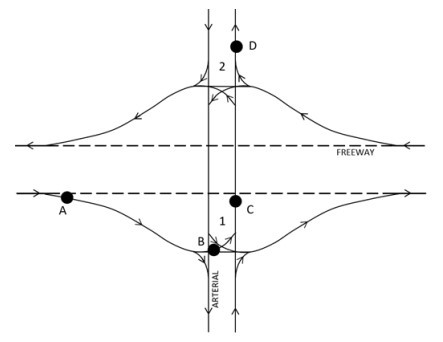
Figure 11-14: Experienced Travel Time at Diamond Interchange
The following equation is applied to calculate the ETT for the movement between points A and D:
ETT
AD
= dELB1
+ dNBT2
+ EDTTAD
= d
ELB1
+ dNBT2
+ (TTABC
- TTAC
)Where:
ETT
AD
= Experienced Travel Time from A to Dd
ELB1
= Eastbound left control delay at first pointd
NBT2
= Northbound through control delay at second pointEDTT
AD
= Extra distance travel time between A and DTT
ABC
= Travel time along path A-B-CTT
AC
= Travel time along (hypothetical) path A-C11.3.4.2 O-D and Turning Movements
Each turning movement (left, through, right, Uturn) of each approach of an interchange has an origin point at the approach leg and a destination point at the departure leg. Each OD pair experiences delay as it travels through the interchange. The sum of these delays makes up the ETT. The LOS for each OD pair is based on the average ETT of the users completing that movement. from HCM 7th Edition, Chapter 34, presents a worksheet for converting turning movement volumes to/from OD movement volumes at a diamond (including DDI) interchange. HCM also includes similar worksheets for a partial cloverleaf interchange, a double roundabout interchange, and a SPUI (one input intersection). Once OD volumes are obtained, the performance of various interchange types can be compared. The worksheets accommodate up to the following number of OD movements:
16 OD movements for roundabout interchanges (turning left, through, right, or U-turn per approach on four approaches);
14 OD movements for diamond (including DDI) interchanges (turning left, though, or right per approach on four approaches and making a U-turn on the major road approaches);
12 OD movements for SPUIs (turning left, though, or right per approach on four approaches); and
12 OD movements for partial cloverleaf interchanges (turning left, right, or U-turn on major road approaches and turning left, though, or right on minor road approaches)
Input | Output | |||||
|---|---|---|---|---|---|---|
Approach | Intersection I | Intersection II | OD Movement Calculation | Volume (veh/h) | ||
Turning Movement | Volume | Turning Movement | Volume | |||
(veh/h) | (veh/h) | |||||
Eastbound (EB) | LT | INT-LT | A = (NB LT) – (NB UT) | |||
EXT-RT | RT | B = NB RT | ||||
EXT-TH | INT-TH | C = SB RT | ||||
Westbound (WB) | INT-LT | LT | D = (SB LT) – (SB UT) | |||
RT | EXT-RT | E = (EB INTLT) – (SB UT) | ||||
INT-TH | EXT-TH | F = EB EXTRT | ||||
Northbound (NB) | LT | LT | G = WB EXTRT | |||
RT | RT | H = (WB INTLT) – (NB UT) | ||||
TH | TH | I = (EB INTTH) – (SB LT) + (SB UT) | ||||
UT | UT | J = (WB INTTH) – (NB LT) + (NB UT) | ||||
Southbound (SB) | LT | LT | K = NB TH | |||
RT | RT | L = SB TH | ||||
TH | TH | M = NB UT | ||||
UT | UT | N = SB UT | ||||
Note: LT=left turn, RT=right turn, UT=U-turn, TH=through, INT=internal, EXT=external. The flows of the two U-turn movements from the freeway (NB UT and SB UT) are user-specified. Shading indicates movements that do not occur in this interchange form. | ||||||
11.3.4.3 LOS Guidelines
Roundabout interchanges and signalized interchanges have separate LOS thresholds. LOS is typically found for each OD movement through the interchange rather than individual turning movements occurring at the different intersections. shows the delay-based LOS criteria for signalized interchanges for each OD pair. LOS is defined as F for any OD pair or lane group that exceeds a volume-to-capacity (v/c) ratio or queue-to-storage ratio of 1.0
ETT (s/veh) | LOS |
|---|---|
≤15 | A |
>15-30 | B |
>30-55 | C |
>55-85 | D |
>85-120 | E |
>120 | F (v/c > 1) |
shows the delay-based LOS criteria for roundabout interchanges for each OD pair. The LOS criterion is the same regardless of whether the interchange is a single or double roundabout
ETT (s/veh) | LOS |
|---|---|
≤15 | A |
>15-25 | B |
>25-35 | C |
>35-50 | D |
>50-75 | E |
>75 | F (v/c > 1) |
When evaluating interchanges using deterministic traffic analysis software, the software does not provide ETT as an output. In those instances, manual (spreadsheet) calculation of ETT can be performed based on the outputs provided by the software. If manual calculation is not possible, it is acceptable to report intersection LOS for each intersection of the interchange. However, ETT results are recommended to be reported when analyzing interchanges in Microsimulation (microscopic) analysis software or HCS. Microsimulation (microscopic) analysis is often used for complex geometry, atypical conditions, and oversaturated conditions.
Additional information on LOS methodology for diamond, cloverleaf, diverging diamond, single-point urban, and roundabout interchanges is covered in Chapter 23 (methodology) of the HCM 7th Edition. Chapter 34 (applications) of HCM 7th Edition provides guidance on selecting an interchange type based on operational performance. The LOS methodology does not cover interchanges with two-way stopcontrolled intersections, interchanges consisting of both roundabout and signalized intersections, or freeway-to-freeway interchanges. Chapter 38 of the HCM presents methodologies for corridors involving freeways and surface streets, including queue spillback. Microsimulation (microscopic) analysis is typically used to analyze the impact of queuing.
When calculating LOS for signalized diamond interchanges, it is recommended that coordination with adjacent arterial signalized intersections be considered, along with optimized timing and the appropriate diamond timing sequence for traffic patterns present or projected.