1.3 Analysis Methodology
The preliminary analysis methodology consists of five categories: data review/collection, alternatives identification, analysis tool consideration and selection, MOE selection, and traffic forecasting.
Information regarding these elements will be filled out on the
Scoping Form
before the scoping meeting and will be updated during the scoping meeting as necessary. shows an
example
of a completed analysis methodology portion of the Scoping Form
, which includes information on data review/collection, alternatives identification, analysis tool consideration and selection, MOE selection, and traffic forecasting.See
Chapter 8
for additional guidance on alternatives analysis.Preliminary Data Review | |
Existing Traffic Data | STARS Historical Traffic Counts ■ K-Factors ■ D-Factors ■ T-Factors ■ Site Observations ☐ Travel Times ☐ National Performance Management Research Data Set (NPMRDS) ■ Big Data (e.g., 3rd party probe data) ☐ Other - |
Field Data Collection Plan | Attach map that specifies locations of applicable data to collect. See ■ Turning Movement Counts ■ Segment Counts ☐ Classification Counts ■ Travel Time ☐ Speed ☐ Big Data (e.g., 3rd party probe data) ☐ High Occupancy Vehicle (HOV) Data ☐ Other - |
Preliminary Alternatives Identification | |
Alternatives to Consider | No-build, addition of general lane northbound and southbound, addition of managed lane northbound and southbound, on/off ramp relocation or closure |
Analysis Tool Considerations | |
Traffic Analysis Software Tools (Select all that apply) | ☐ CAP-X ☐ HCS ☐ Synchro ☐ SIDRA ☐ Visum ■ Vissim ☐ Vistro ☐ Cube ☐ TransCAD ☐ SimTraffic ☐ CORSIM ☐ Other - |
Microsimulation | Characteristics to calibrate: ■ Simulated Travel Time ■ Simulated Traffic Volume ☐ Simulated Queue Length ☐ Other - |
Important location(s) to calibrate: NB and SB on IH-35, intersection volumes | |
Initial MOE Selection | |
Traffic MOEs (Select all that apply) | ☐ v/c Ratio ■ Travel Time ■ Speed ■ Delay ■ LOS ☐ Queue Length ☐ Trip Reliability ☐ Other - |
Traffic Forecasting | |
Traffic Forecasting Methodology | Specify Option: ☐ TPP Led ■ District Led Specify Methodology: ☐ Traffic Projections from Nearby Projects ■ Travel Demand Model Outputs Forecasts ■ Traffic Projections from Historical Growth Rates ☐ Other - |
1.3.1 Data Review and Collection
Data review and collection consists of three components:
- Gathering available data from existing sources (e.g., Statewide Traffic Analysis and Reporting System (STARS) traffic counts, the NPMRDS, multi-modal data such as TxDOT Comprehensive Accessibility Program (TCAP), CRIS crash reports, INRIX travel times and OriginDestination (OD) data, and other big data sources that accomplish a similar purpose).
- Determining safety analysis and operational analysis data needs.
- Creating a field data collection plan to specify the location and types of data that will be collected.
To summarize, the data review process will be used to determine existing data availability, to determine additional data needed for the project, and to make a data collection plan. The data collection plan will be in map format and specify types of data and locations for all necessary data collection points (DCP). shows an
example
of the data collection map. Generally, 100 days of traffic data collection (segment counts) are recommended for FHWA approved projects. For other projects, 7 days are typically recommended for data collection and are to be based on coordination with the TxDOT project manager. See
Chapter 2
for additional guidance on data sources, collection, and summarization. See Chapter 5
and Chapter 6
for additional guidance on safety data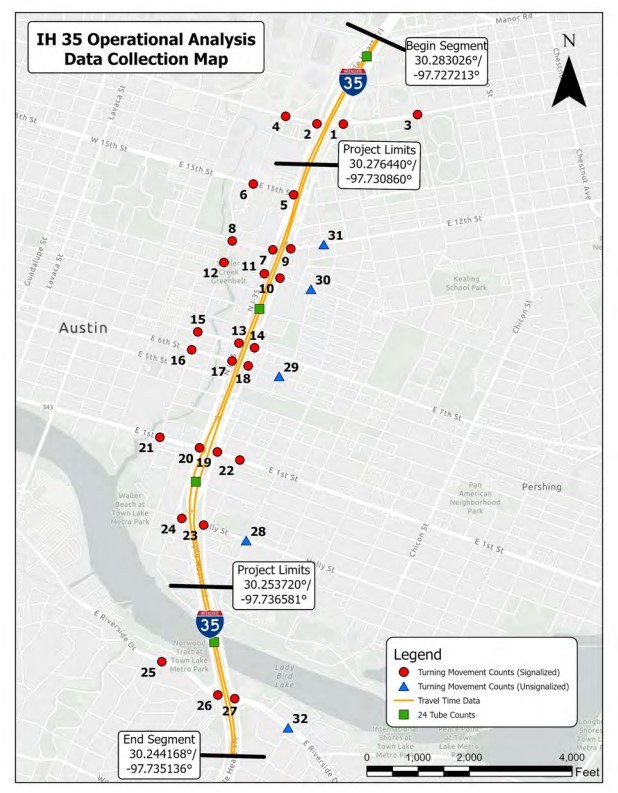
Figure 1-2: Data Collection Example Map
1.3.2 Alternatives Identification
Alternatives identification is the process of considering multiple alternatives that use different configurations to accomplish the same goal. After alternatives are selected, they are analyzed, and their results are compared to determine which option best accomplishes project goals and objectives.
While the outcomes for alternatives are not known before analysis begins, preliminary alternatives identification is critical because it leads to effective utilization of limited resources. Alternatives to be analyzed will be listed on the
Scoping Form.
See
Chapter 8
for detailed information on alternatives identification and analysis.1.3.3 Analysis Tool Considerations and MOEs
Tool selection is based on many variables, such as project type, size, complexity, facility type, level of detail, analysis level, data requirements, desired metrics, tool functionality, and industry standards.
Figure 4- 1
in Chapter 4
can be used to gain a general understanding of tool selection based on level of detail, analysis level, and resource intensity. Some projects may need multi-resolution analysis, which could necessitate the selection of more than one tool for analysis. In these circumstances, refer to the Multi-Stage Analysis section of Chapter 4
.For further guidance on tool selection, see the following:
- Chapter 4– Guidance on operational analysis tool selection for other modes, facility types, and project types;
- Chapter 6, Section 2– Guidance on safety analysis tool selection;
- Chapter 14, Figure 14-1– Guidance on tool selection for pedestrian analysis; and
- Chapter 14, Figure 14-3– Guidance on tool selection for bicycle analysis
Calibration is the process of adjusting model parameters so that the model results accurately represent field conditions, which is necessary when developing a base conditions model using Microsimulation (Microscopic) tools such as Vissim. Typical characteristics to calibrate include traffic volumes, travel times, and queue length. It is recommended that calibration characteristics and critical calibration links (i.e., segments with weaving, bottlenecks, a volume-to-capacity (v/c) ratio > 1, etc.) be listed on the
Scoping Form
and a calibration map be attached to the Scoping Form
. Other tools may necessitate calibration, and relevant calibration characteristics and important links to calibrate can be specified on the Scoping Form.
See Chapter 13
for detailed information on calibration methodology and procedures.Performance measures objectively report project conditions concerning specific criteria. Traffic analysis performance measures are often related to mobility and may include safety, accessibility, reliability, and others (see
Chapter 5
and Chapter 6
for Safety MOEs). Analysis tools selected for a project often determine which metrics will be used to evaluate project conditions. However, project specific circumstances may merit the selection of a certain performance measures. Performance measures are selected based on the vision, mission, goals, and objectives of the project. Common performance measures and MOEs reported by common analysis tools are shown in Table 4-4 of Chapter 4.For further guidance on MOE applications, see the following:
- Chapter 4- Guidance on traffic analysis tools and MOEs;
- Chapter 5 and Chapter 6- Guidance on safety analysis tools and MOEs; and
- Chapter 13- Conditions and situations that use microsimulation
1.3.4 Traffic Volume and Forecasting
Traffic forecasting involves determining who will develop the traffic forecast, how the forecast will be developed (i.e., which forecasting methodology), and who will approve the traffic forecast. After determining who will develop and approve the forecasts, it is suggested that the choice is marked in the traffic forecasting section of the
Scoping Form
by checking TPP Led or District Led. Depending on who is developing and approving the traffic forecast, selecting forecast methodology may be necessary. If the project lies within an MPO with a TDM, then the analyst can consider using the MPO’s TDM. If the project is outside the MPO boundaries with a TDM, the analyst can consider using TxDOT’s Statewide Analysis Model (SAM) outputs.
Other methods of traffic forecasting include historical trends and growth patterns. Typically, more than one method of traffic forecasting is used to cross-validate forecast results.
Document traffic forecasting assumptions on the
Scoping Form
and include information about which MPO’s TDM will be used, where historical volumes will be taken to obtain a historical growth rate, or what planned land uses were used to develop growth patterns for traffic forecasting. For additional guidance on traffic volume and forecasting, refer to the TxDOT TPP Traffic Forecasting Analysis Standard Operating Procedures (SOP). Coordinate with the TxDOT project manager to gain access to the latest SOP. An internal link to the SOP is also found in
Appendix B, Section 4 – External References (Reference 1)
.