1.2 Introductions and Project Descriptions
The introductions of a project include personnel involved in the project. It includes the TxDOT project manager, the project manager for the performing organization, and other TxDOT groups, Divisions, and Districts. FHWA may be involved in the process if the project involves an interstate. Specify these key personnel on the
Scoping Form
. The project description serves as a defining set of characteristics that are either descriptive or serve to guide analysis methodologies. Characteristics in the project description include:
- Project name and control section job (CSJ) or Project ID;
- Location (i.e., City, County, and District of the project);
- Project overview;
- Analysis level and level of detail;
- Scope of work;
- Study limits;
- Geographical limits (spatial);
- Analysis time periods (temporal);
- Analysis years and peak periods;
- Background factors that may influence the project; and
- Project schedule
While some of the project descriptors are self-explanatory, more detailed information on some of the characteristics are in
Sections 1.2.1
through 1.2.7
. Specify the project descriptors on the Scoping Form
.1.2.1 Project Overview
The project overview section briefly describes basic elements of the project such as analysis type and the facility type. Include other descriptive information about the project in the project overview section. See for an example of how to fill out this section.
1.2.2 Project Development Stage (PDS)
The PDS describes the position of a project in its life cycle. The three main PDSs are:
- Planning
- A broad study that helps identify the needs and goals of future transportation. A process that involves alternatives analysis, where alternatives are considered, analyzed, compared, and selected. In the context of this manual, planning includes both the planning and programming of a project
- Preliminary Schematics
- The middle stage, where project information becomes more detailed and developed into a plan. In the context of this manual, preliminary design, environmental, right of way (ROW), and utilities are grouped into preliminary schematics.
- Final/Approved Schematics and Plans, Specifications, and Estimates (PS&E)
- The end stage when all project details and plans are developed for construction or implementation.
The PDS can be considered multi-stage if it includes a combination of Planning, Preliminary Schematics, or Final/Approved PS&E. The PDS is one factor to determine which analysis tool will be used for a project. For more information about the PDS, see
Chapter 4, Section 2
. See for an example of how to fill out this section.1.2.3 Level of Detail
The level of detail is different than the PDS and describes the detail necessary to complete an analysis. Analysis tools are often categorized into varying levels of detail. The necessary level of detail for an analysis, as well as project scope and complexity, often influence tool selection. Level of detail is divided into three categories:
- Sketch-Level or Macroscopic
- Sketch-level analysis tools may use less input and detail. This type of tool may be suitable for projects that have limited resources (data, budget, expertise, personnel, time, etc.), or projects that do not use high levels of detail. An example of a tool in this category is Capacity Analysis for Planning of Junctions (CAP-X).
- Macroscopic tools, such as travel demand model (TDM) outputs, may be used for complex projects that have regional/subregional impacts. Analyses that use these types of tools often involve more resources than typical sketch-level tools. Coordination with TxDOT’s Transportation Planning and Programming (TPP) Division or the local Metropolitan Planning Organization (MPO) may be necessary when travel demand outputs are used for a project.
- HCM-Based (Mesoscopic)
- Analysis tools at this level involve a medium amount of input and detail or are HCM-based.
- An example of this type of tool is the Highway Capacity Software (HCS).
- Microsimulation (Microscopic)
- Analysis tools at this level likely involve the most input and detail. They are suitable for projects that are complex or use detailed operational analysis. Examples of these tools include Verkehr in Staedten Simulation (Vissim), Corridor Simulation (CORSIM), and SimTraffic..
Like the PDS, the level of detail can also be considered multi-resolution if the analysis includes a combination of Sketch-Level or Macroscopic, HCM-Based (Mesoscopic), and Microsimulation (Microscopic) tools. Use the PDS and level of detail to guide the selection of appropriate tools for analysis. Determination of level of detail (including multi-resolution modeling) for scoping is based on a variety of factors; work with the TxDOT project manager, TxDOT’s Design Division (DES), and/or TPP to determine which level of detail fits for the project. See for an
example
of how to fill out this section.Analysis tools typically used in safety-related projects include TxDOT’s Safety Scoring Tool (SST), Safety Performance of Intersection Control Evaluation (SPICE), HSM for Rural Multilane, HSM for Urban/Suburban Arterials, HSM for Rural Two-Lane Roads, Enhanced Interchange Safety Analysis Tool (ISATe), Highway Safety Software (HSS), and Interactive Highway Safety Design Model (IHSDM). These tools are often used to achieve results varying in level of detail.
1.2.4 Scope of Work
The scope of work is an agreement on the work to be performed for a project. The basic scope of work is defined by the type of project (e.g., new roadway, adding capacity, operations analysis, signal analysis, corridor study, planning study, safety study, toll feasibility analysis, etc.) and is specified on the
Scoping Form
. Preventive Maintenance (PM) and resurfacing or restoration (2R) projects typically do not involve traffic analysis. Resurfacing, restoration, or rehabilitation (3R) projects may involve traffic analysis, especially if roadway geometrics are changed. Reconstruction (4R) projects typically involve traffic analysis. The level of detail depends on the project scope. It is recommended that a description of the scope of work be included and answer questions such as:- What is the purpose of the project?
- What are the project goals and objectives?
- What issues will the project address?
- What are the project milestones?
- What are the deliverables?
During the project scoping meeting, refine the scope of work and modify it as agreed-upon.
1.2.5 Performance Based Practical Design (PBPD)
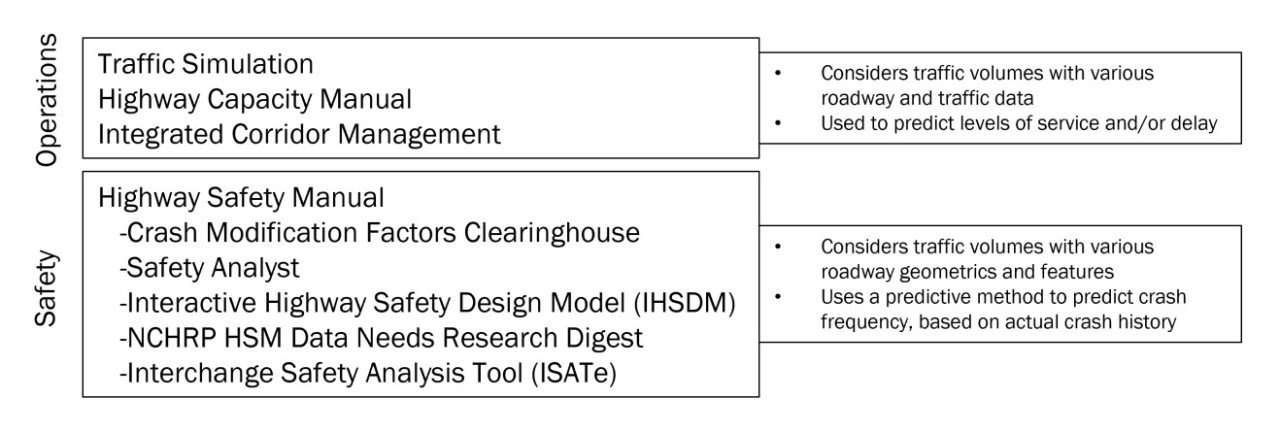
State within the Scope of Work if PBPD will be used. PBPD is a decision-making approach to better manage transportation investments and serve system-level needs and performance priorities with limited resources. PBPD uses performance evaluations during project development to guide alternative selections and, ultimately, geometric design decisions. During the planning stage, PBPD defines system and project purpose and need, develops concise project objectives from the purpose and need, considers project in the context of the system, and addresses all users. PBPD is based on quantitative analysis for system performance, operations, or safety, and allows for flexibility in design while still meeting project objectives. During preliminary engineering and design, PBPD develops solutions that meet the purpose and need and evaluates tradeoffs based on objective analysis of data. PBPD analysis includes a cost-benefit analysis. shows operational and safety tools that incorporate PBPD. When used in planning and design, these tools can be used to compare and select alternative designs based on the operations and/or the number of predicted crashes for each alternative. Costs include cost of constructing or implementing improvements and cost of maintenance. Benefits are calculated in terms of delay savings and crash reduction savings. For more information on Cost-Benefit Analysis, see
Chapter 10, Section 10.3.6
. Refer to TxDOT’s RDM for additional information on PBPD.Table 1-2: Operational and Safety Analysis Tools that Incorporate PBPD
1.2.6 Geographic (Spatial) Limits
The geographic (spatial) limits include the project improvement locations (project area) and the area impacted by the project improvement (study area). Spatial limits for operation and safety are typically the same. For spatial limits, it is recommended to attach a map to the
Scoping Form
. For an example
of the spatial limit map, see .Below are sample prompts that may provide guidance:
- Spatial Limits:What is the overall project location? What intersections, interchanges, segments, or other facilities are to be included in the analysis? Is this an Interstate Access Justification Report (IAJR) that requires upstream and downstream interchanges to be included? For freeways, is it recommended that the main lanes and frontage roads be considered?
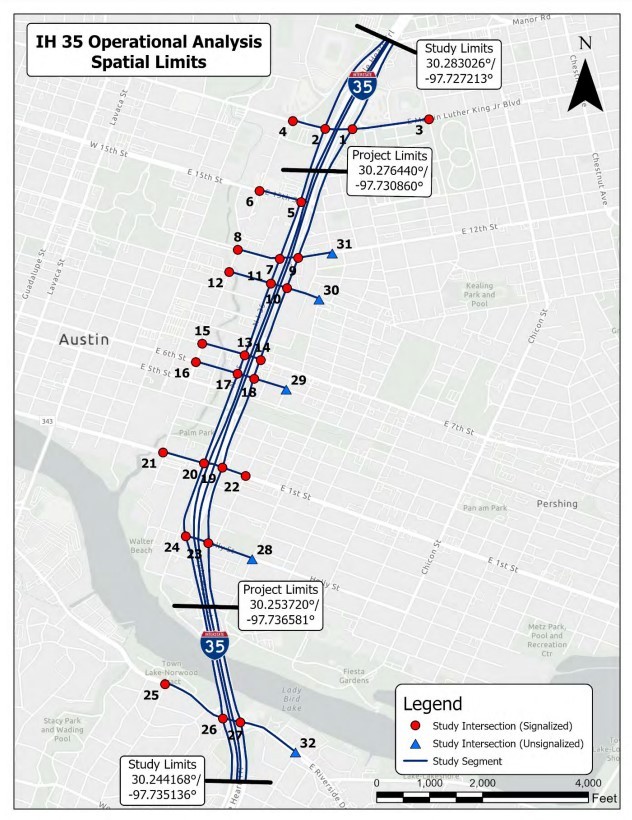
Figure 1-1: Spatial Limits Map Example
1.2.7 Analysis Years and Peak Periods
Time (temporal) limits for an operational analysis include the analysis years and analysis periods. Typical analysis years often include the following:
- Existing Year – Existing year analysis represents the current conditions analysis and is typically completed using data less than three years old. If the project is using data more than three years old, include verification about how the volumes represent existing conditions.
- Opening Year – The opening year is the first year in which the proposed improvements are expected to be open to traffic. If the project is proposed to be implemented in phases, the opening year is the year the first phase of traffic will be opened to traffic. The opening year is typically determined by project size, complexity, and schedule, with respect to the letting date. The let date is defined as the official receipt and opening of bids and determination of the apparent low bidder. It is dependent on the planning and programming of projects.
- Interim Year – An interim year is the opening year of different phases of the project after the first phase. Interim years are sometimes used if the proposed improvements show failing level of service prior to the design year.
- Design Year – Projects are planned and designed to meet the future, anticipated needs and characteristics of a certain year. This is referred to as the design year. Typically, the design year is 20 years after the anticipated project opening year.
The analysis years listed above are typical, but can vary based on project type (e.g., resurfacing, restoration, or rehabilitation projects often have analysis years of five to 10 years). Pavement design year is used for traffic projections but is not needed for traffic analysis. It is typically 10 years after the design year and represents useful life of the pavement. The analysis period is the time of day when the analysis will be conducted.
Typical traffic analysis time periods (temporal limits) include a weekday AM peak and a weekday PM peak. There are situations that warrant different analysis periods (e.g., analysis of a facility near a school, mall, or sports arena; analysis of a facility with heavy weekend traffic). Part of the scoping process is identifying the analysis day(s) and the analysis periods (e.g., AM Peak: Tuesday-Thursday, 7:15AM – 8:15AM).
Temporal limits for a historical safety analysis typically include the most recent three to five years. Temporal limits for a predictive safety analysis typically include the opening and design years. For projects that need FHWA approval, request Crash Records Information System (CRIS) data through TxDOT's Traffic Safety Division (TRF) or the Design Division.
Below are sample prompts that may provide guidance on selecting temporal limits:
- What are the analysis years for each study area?
- What are the analysis periods for the study?
1.2.8 Background Factors and Project Schedule
It is suggested that background factors which may influence the project are included on the
Scoping Form
. These background factors may include planned roadway improvements (geometric, operational, safety, etc.), planned developments (developments that change traffic patterns), input from various TxDOT groups, and other factors that have an influence on travel and safety. It is recommended that a preliminary project schedule be attached to the Scoping Form
when sharing the document with the TxDOT project manager. The project schedule establishes the start date and completion date of the project and includes major project milestones (e.g., project administration, data collection, traffic analysis, safety analysis, agency coordination, renderings, and work authorization termination date). For an example
, see Appendix B, Section 3 – Example Project Schedule
. Project Description | |||
|---|---|---|---|
Project Name | IH-35 Capacity Analysis | Project CSJ or Project ID | 1111-11-111 |
City, County | Austin, Travis | District | Austin |
Project Overview | I-35 Capacity/Congestion Study | ||
Analysis Level | ■ Planning ☐ Preliminary Schematics ☐ Final/Approved Schematics and Design ☐ Multi-Level ☐ Other | ||
Level of Detail (Select all that apply) | ☐ Sketch-Level or Macroscopic ☐ HCM-Based (Mesoscopic) ■ Microsimulation (Microscopic) ☐ Multi-Resolution ☐ Other | ||
Scope of Work (Select all that apply) | ☐ New Roadway ■ Add Capacity ■ Operations Analysis ☐ Signal Analysis ■ Corridor Study ☐ Feasibility Study ☐ Route Study ☐ Safety Study ☐ Toll Feasibility Analysis ☐ Other Operational analysis for multiple alternatives on 1.89 miles of IH-35 and operational analysis for multiple alternatives at 27 signalized intersections and five unsignalized intersections | ||
Spatial Limits | See Figure 1-1 (include project area and study area) | ||
Analysis Years and Peak Periods | Opening Year: 2030 Design Year: 2050 Pavement Design Year: 2060 AM Peak Hour/Period (weekday): 7:30 – 8:30 PM Peak Hour/Period (weekday): 5:00 – 6:00 Other Peak: Not Applicable Crash Data Analysis Year(s): Historical – Most recent 5 calendar years, Predictive – 2030, 2050 | ||
Background Factors that May Influence the Project | New BRT route addition adjacent to UT Austin | ||
Project Schedule | See Appendix B, Section 3 – Example Project Schedule | ||