9.3 HCM-Based (Mesoscopic) Analysis
9.3.1 Overview and Intended Use
HCM-based (mesoscopic) analysis combines characteristics of both Sketch-level or macroscopic and Microsimulation (microscopic) analysis. Like Sketch-level or macroscopic analysis, the behavior of individual vehicles is based on the average speed on the segment and is not sensitive to changing relationships between traffic variables. Like Microsimulation (microscopic) analysis, vehicle classifications and driver behavior parameters are tied to individual vehicles. HCM-based (mesoscopic) analysis combines the properties of both microscopic and macroscopic simulation models. Queueing is considered on a segment-wide, not vehicle-specific, level. HCM-based (mesoscopic) analysis is used when the Sketch-level or macroscopic analysis does not capture enough detail, such as the impact of specific operational improvements or congestion levels.
HCM-based (mesoscopic) analysis is suitable for projects that need moderate level of detail; they need more input than Sketch-level or macroscopic tools and are useful for smaller study areas.
9.3.2 Analysis Tools
HCM based methods are used for segment analysis when a TDM is unavailable or unsuitable for the project. Several types of HCM-based (mesoscopic) software can be used to analyze segments. As with all HCM-based (mesoscopic) tools, they are deterministic and will output the same results given the same inputs. HCS is the recommended software when conducting segment analysis, but other HCM-based (mesoscopic) software can be used if HCS is unavailable or does not include analysis of the facility type in question. Synchro is recommended for the analysis of arterial roadways and other segments whose LOS is mainly based on intersection delay. Detailed illustrations of inputs and outputs of HCS can be found in
Appendix J, Section 2 – HCS Data Inputs and Outputs by Segment Type
. For detailed guidance on inputs and outputs of other HCM-based (mesoscopic) tools, refer to each tool’s user guide and/or software. Several available software and analysis capabilities include:- HCS;
- Facility capabilities
- Basic freeways
- Basic multi-lane highways
- Weaving segments of freeways
- Merge and diverge segments of freeways
- Two-lane highways
- Arterial facilities
- FREEVAL;
- Facility capabilities
- Basic freeways
- Basic multi-lane highways
- Weaving segments of freeways
- Merge and diverge segments of freeways
- Two-lane highways
- Other capabilities
- Work zone impact assessment
- Managed lanes analysis
- Travel time reliability analysis
- HCM-CALC; and
- Facility capabilities
- Basic freeways
- Basic multi-lane highways
- Weaving segments of freeways
- Merge and diverge segments of freeways
- Two-lane highways
- Synchro
- Facility capabilities
- Segments with signalized intersections
- Segments with roundabouts
- Segments with all-way stop-control or two-way stop-control
While some of the default values in the software listed above can be used to conduct analysis of segments, it is recommended that four characteristic inputs to these tools represent actual conditions in the field:
- Segment length
- Free flow speed
- Number of lanes
- Flow rates
Field data for other default values are collected and inputted based on engineering judgement.
9.3.2.1 Texas A&M Transportation Institute (TTI) Procedures
TTI has developed procedures for analyzing one-way and two-way frontage roads. Frontage roads operate similarly to arterials since they are corridors with signalized or unsignalized intersections. However, frontage roads also have ramp connections to and from freeways and driveways on only one side. TTI used HCM’s urban and suburban arterial LOS analysis as a base model for analyzing frontage roads and made modifications to the methodology to account for ramp interactions and driveways to develop a seven-step process for evaluating frontage road operations. The steps can be repeated to analyze both sides of a two-way frontage road. It is recommended to follow the seven-step process, substituting the latest HCM methodologies where relevant. See for a flowchart that provides an overview of TTI’s seven-step process for frontage road analysis. A guide with
examples
is included in Appendix J, Section 1 – TTI Frontage Road Analysis Steps and Examples
.9.3.3 Data and Input Parameters
9.3.3.1 HCM Method
The data and input requirements for the HCM Method are similar across software. This section focuses on the inputs necessary to conduct a segment analysis using HCS. For a detailed list of HCS input by segment type, see
Appendix J, Section 2 – HCS Data Inputs and Outputs by Segment Type
. Table 9-4 has a simplified list of the necessary data for each segment type.9.3.3.2 Synchro
Synchro is typically used to analyze segments whose LOS is governed by intersection delay. Data inputs to Synchro include geometric data, lane settings, volume settings, timing settings, and phasing settings. For detailed inputs to a Synchro model, refer to the Synchro user guide.
9.3.3.3 TTI Frontage Road Analysis Procedures
Data requirements for a frontage road analysis are broken into two categories: one-way analysis inputs and two-way analysis inputs. A summary table of data inputs for each type of frontage road is shown in .
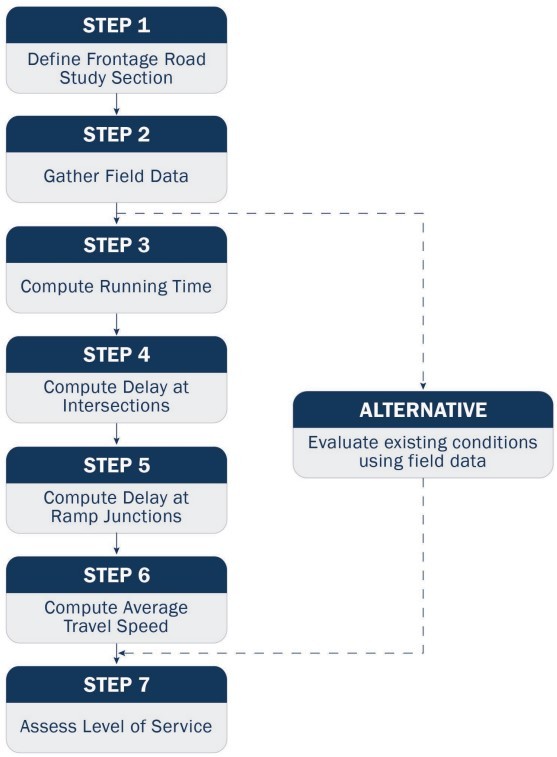
Figure 9-2: TTI Frontage Road Analysis Methodology Flowchart
Segment Type | Corresponding HCS7 Analysis Type | Necessary Data |
|---|---|---|
Freeways (Basic) | FREEWAYS →Freeways →Basic |
|
Multi-lane Highways (Basic) | HIGHWAYS →Multilane |
|
Weaving | FREEWAYS →Freeways →Weaving |
|
Merge and Diverge | FREEWAYS →Freeways →Merge or Diverge |
|
Two-lane Highways | HIGHWAYS →Two-lane |
|
Arterial Facilities | STREETS →Streets |
|
Type of Data | Data Necessary | Frontage Road | |
|---|---|---|---|
One-Way | Two-Way | ||
Roadway Characteristics | Segment length (km) | Necessary | Necessary |
Type of traffic control at intersections (e.g., no-control, stop-controlled, or traffic signal) | Necessary | Necessary | |
Number of all exit and entrance ramps | N/A | Necessary | |
Number of exit ramps without auxiliary lanes | Necessary | N/A | |
Segment access density, access/km (number of driveways and unsignalized intersections per kilometer) | Necessary | Necessary | |
Traffic Data | Frontage road approach volume at stop-controlled and signalized intersections, vehicles per hour (vph) | Necessary | Necessary |
Ramp and frontage road volumes at all exit and entrance ramps, vph | N/A | Necessary | |
Exit ramp and frontage road volumes at exit ramps without auxiliary lanes, vph | Necessary | N/A | |
Signal Data | Signal progression data | Necessary | Necessary |
Intersection capacity (c), vph | Necessary | Necessary | |
Cycle length (C), sec | Necessary | Necessary | |
Green/cycle time ratio (g/C) | Necessary | Necessary | |
Volume/capacity ratio (v/c) | Necessary | Necessary | |
9.3.4 Measures of Effectiveness (MOEs)
9.3.4.1 HCM Method
Outputs of a segment analysis vary by facility type and by analysis tool used. For a detailed illustration of HCS outputs by segment type, see
Appendix J, Section 2 – HCS Data Inputs and Outputs by Segment Type
. For outputs of other HCS-based tools, refer to the tool’s user guide9.3.4.2 Freeways
LOS for freeway facilities is based on the facility-wide average density expressed in pcpmpl. There are separate density thresholds for urban and rural locations. The LOS for an overall freeway facility is typically accompanied by the LOS for the individual segments. LOS for basic freeway segments, weaving segments, merge, and diverge segments are also based on density. The LOS thresholds apply to both urban and rural locations. The thresholds for weaving segments are higher than basic segments because drivers tolerate higher density in areas where lane-changing is expected. Supplemental information with
example
applications are provided in HCM 7th Edition Chapter 25 (freeway facilities), Chapter 26 (freeway and highway segments), Chapter 27 (freeway weaving), and Chapter 28 (freeway merges and diverges). For LOS criteria of various freeway facilities see and .LOS | Density (pc/mi/ln) |
A | ≤ 11 |
B | >11-18 |
C | >18-26 |
D | >26-35 |
E | >35-45 |
F | Demand exceeds capacity OR density > 45 |
LOS | Urban Freeway Facility Density (pc/mi/ln) | Rural Freeway Facility Density (pc/mi/ln) |
A | ≤11 | ≤6 |
B | >11-18 | >6-14 |
C | >18-26 | >14-22 |
D | >26-35 | >22-29 |
E | >35-45 | >29-39 |
F | >45 or any component section v/c ratio > 1.0 | >39 or any component section v/c ratio > 1.0 |
LOS | Density (pc/mi/ln) |
A | ≤10 |
B | >10-20 |
C | >20-28 |
D | >28-35 |
E | >35 |
F | Demand exceeds capacity |
LOS | Freeway Weaving Segments | Weaving Segments on Multilane Highways or Collector-Distributor Roads |
A | 0-10 | 0-12 |
B | >10-20 | >12-24 |
C | >20-28 | >24-32 |
D | >28-35 | >32-36 |
E | >35-43 | >36-40 |
F | >43, or demand exceeds capacity | >40, or demand exceeds capacity |
9.3.4.3 Highways
The LOS thresholds for multi-lane highway segments are the same as basic freeway segments. The thresholds for weaving segments on multi-lane highways, however, are different than the thresholds for freeway weaving segments, as presented in . The LOS criteria for freeway merge and diverge segments are used for merge and diverge segments on multi-lane highways. See for HCM’s LOS criteria for multi-lane highways.
LOS criteria for two-lane highways are based on three performance measures: ATS, PTSF, and PFFS. ATS is the segment length divided by average travel time for the segment. See
Chapter 4
for definitions of PFFS and PTSF. Additional information, with example
applications, is available in HCM 7th Edition Chapter 26 (freeway and highway segments), Chapter 27 (freeway weaving), and Chapter 28 (freeway merges and diverges). See for the LOS criteria for two-lane highways in the HCM.LOS | Density (pc/mi/ln) |
A | ≤ 11 |
B | >11-18 |
C | >18-26 |
D | >26-35 |
E | >35-45 |
F | Demand exceeds capacity OR density > 45 |
LOS | Follower Density (followers / mi / ln) | |
Higher-Speed Highways Posted Speed Limit ≥ 50 MPH | Lower-Speed Highways Posted Speed Limit < 50 MPH | |
A | ≤ 2.0 | ≤ 2.5 |
B | > 2.0 – 4.0 | > 2.5 – 5.0 |
C | > 4.0 – 8.0 | > 5.0 – 10.0 |
D | > 8.0 – 12.0 | > 10.0 – 15.0 |
E | > 12.0 | > 15.0 |
F | Demand exceeds capacity | |
9.3.4.4 Arterials (or Urban Streets)
The LOS thresholds for urban arterial segments are based on travel speed of the vehicles traveling through the segment. HCM-based (mesoscopic) analyses are applicable for arterial and collector street segments with a length of two miles or less. If a segment is longer than two miles between boundary intersections, it is recommended that it is treated as a highway and the intersections are studied individually. If the segment being studied has intersections along its length, the speed and travel times of vehicles is largely dependent on intersection delay. Supplemental information with
example
applications is found in HCM 7th Edition Chapter 29 (Urban Street Facilities: Supplemental) and Chapter 30 (Urban Street Segments: Supplemental). shows the LOS criteria for urban arterial segments.LOS | Travel Speed Threshold by Base Free-Flow Speed (mi/h) | Volume-To-Capacity Ratio a | ||||||
55 | 50 | 45 | 40 | 35 | 30 | 25 | ||
A | >44 | >40 | >36 | >32 | >28 | >24 | >20 | ≤1.0 |
B | >37 | >34 | >30 | >27 | >23 | >20 | >17 | |
C | >28 | >25 | >23 | >20 | >18 | >15 | >13 | |
D | >22 | >20 | >18 | >16 | >14 | >12 | >10 | |
E | >17 | >15 | >14 | >12 | >11 | >9 | >8 | |
F | ≤17 | ≤15 | ≤14 | ≤12 | ≤11 | ≤9 | ≤8 | |
F | Any | >1.0 | ||||||
Note:
a
Volume-to-capacity ratio of through movement at downstream boundary intersection.9.3.4.5 TTI Method
The LOS of frontage roads is based on the ATS of vehicles traveling through the segment, which is a function of segment length and total travel time. Travel time is estimated using TTI’s procedures or measured directly in the field. For an analysis requiring medium amounts of detail, it is recommended that travel time be estimated using TTI’s procedures or calculated using HCS or similar software. Travel time is a function of running time (the time it takes to travel a segment), intersection delay, and ramp delay. Factors that influence the operations of a frontage road include the intersections along the segment and the driveways along the segment