2.2 Types of Data
This section provides an overview of the different types of data that are used in traffic operational and safety analysis. It is important that all data is collected within the same timeframe to avoid any inconsistencies between the different data types. The different types of data, their collection methods, and resources mentioned in this section below are summarized in
Section 2.5
in . Note that prior to beginning data collection, it may be useful to check the existing traffic operation data sources, which are listed in Section 2.3
.2.2.1 Geometric Data
Geometric data is related to the physical characteristics of the roadway facility. Below is a list of general geometric data that may be needed to perform traffic analyses. Additional data may be needed depending on the characteristics of the project study area; this is not an exhaustive list.
- Geographic coordinates (e.g., NAD 83);
- Number of lanes;
- Lane assignment;
- Lane, shoulder, and crosswalk widths;
- Presence of sidewalks and pedestrian elements;
- Type of lane (e.g., general purpose, managed lanes, bus-only lane, bike lane);
- Length of turn lanes or bays;
- Ramp spacing;
- Clear zone;
- Curvature of roadway (i.e., centerline alignment);
- Grade;
- Median width;
- Median type (e.g., divided, undivided, barrier);
- ROW;
- Driveway entries and location; and
- Location of railroad crossings
Geometric data can be gathered using TxDOT’s Open Data Portal, online aerial imagery (e.g., Google Earth, Google Maps, Bing Maps, Nearmap), survey files, as-builts (i.e., plans that reflect the project as actually constructed), and other online resources. However, it is recommended that a field visit be performed, when possible, to verify the existing geometric conditions data gathered digitally. A field visit is necessary to verify geometric information in areas with limited or dated aerial imagery, or when as-builts are not available.
2.2.2 Traffic Operational Data
Traffic operational data is based on traffic control devices and roadway characteristics other than roadway geometry. Below is a list of general traffic operational data needed to perform traffic analysis. This is not an exhaustive list.
- Speed limits, operating speeds, and/or design speeds if available;
- Traffic control types and locations;
- Traffic signal timing plans;
- Driveway spacing/location;
- Parking occupancy (e.g., supply, temporal demand, turnover);
- Parking type (e.g., angled, parallel, backin);
- Roadway functional classification;
- Area type (e.g., rural, urban, suburban);
- Driver behavior (e.g., rate of acceleration, rate of deceleration, lane changing behaviors, car following parameters);
- Lane utilization;
- School zones;
- Railroad preemption; and
- Signage types and locations (e.g., regulatory, warning, guidance signs)
Multiple sources of data may be needed to gather all the traffic operational data used to perform a traffic operational analysis. Data such as speed limits, intersection control, and roadway classification is available in the field or with online aerial imagery, a Geographic Information System (GIS) database, or other online resources. Other data, such as the timing for signals or the parking occupancy rate, may necessitate coordination with the governing public agency. Data such as lane utilization and driver behavior field observations to verify traffic operational conditions.
2.2.3 Traffic Counts
One of the fundamental data types needed to perform traffic operational analysis is traffic count data. There are several types of counts that may be needed based on the level of detail necessary for the analysis. It is recommended that traffic count data be collected on typical weekdays that represent a typical day’s travel patterns. Avoid days with atypical traffic conditions, which can be caused by the following situations:
- On or around holidays;
- Especially for areas that are retail-heavy, unless the study is specifically to analyze impacts during such time periods
- During inclement weather;
- During crashes or other major incidents affecting travel patterns;
- During construction or lane closures within the project limits;
- During construction or lane closures in the vicinity of the project that result in detours within the project limits;
- During summer break or other times when school is not in session; or
- Any other situations that may present atypical travel patterns (e.g., special events)
It is recommended that traffic counts be collected for atypical travel patterns based on project specifics. For example, if the purpose of the project is to study summer traffic due to an increase in tourism, game-day traffic at stadiums, holiday or event traffic, or other unique situations, an atypical traffic count could be necessary.
In general, collect traffic counts in 15-minute time intervals for the defined time period(s). It is suggested that traffic counts begin before the start of the congestion and end after congestion dissipates.
2.2.3.1 Turning Movement Counts (TMCs)
TMCs count vehicles, pedestrians, and bicyclists making a specific movement or turn at an intersection for all approaches during a defined period. Collect TMCs on a typical weekday and for a minimum of two consecutive weekdays, based on coordination with the TxDOT project manager. A typical weekday count is defined as a count occurring on a Tuesday, Wednesday, or Thursday. It is recommended that the traffic count data be collected in 15-minute increments and during the same period as the remainder of the data collection. TMCs may include vehicular, pedestrian, and bicyclist modes of travel.
Recommended TMC collection method:
- 15-minute increments;
- Typical weekday peak period (Tuesday, Wednesday, Thursday);
- Two consecutive weekdays; and
- Minimum of 2-hour period, which includes the peak hour
For atypical locations, it is suggested that the period of collection is based on the circumstances. Examples include corridors or roadways near malls, stadiums, or other land uses that generate large volumes of traffic at non-standard times of day.
2.2.3.2 Segment Traffic Counts
Segment traffic counts are conducted along a roadway during a typical week for a consecutive seven-to-14-day period for Interstate IAJR projects with microsimulation and one to two days for other projects. This is based on coordination with the TxDOT project manager and collected in 15-minute increments. Segment traffic counts are often separated by direction to analyze directional split. For analyses that use microsimulation as part of an IAJR, segment traffic counts are recommended to be conducted for a period of at least 7-to-14 consecutive days. is an
example
of a generic segment traffic count location.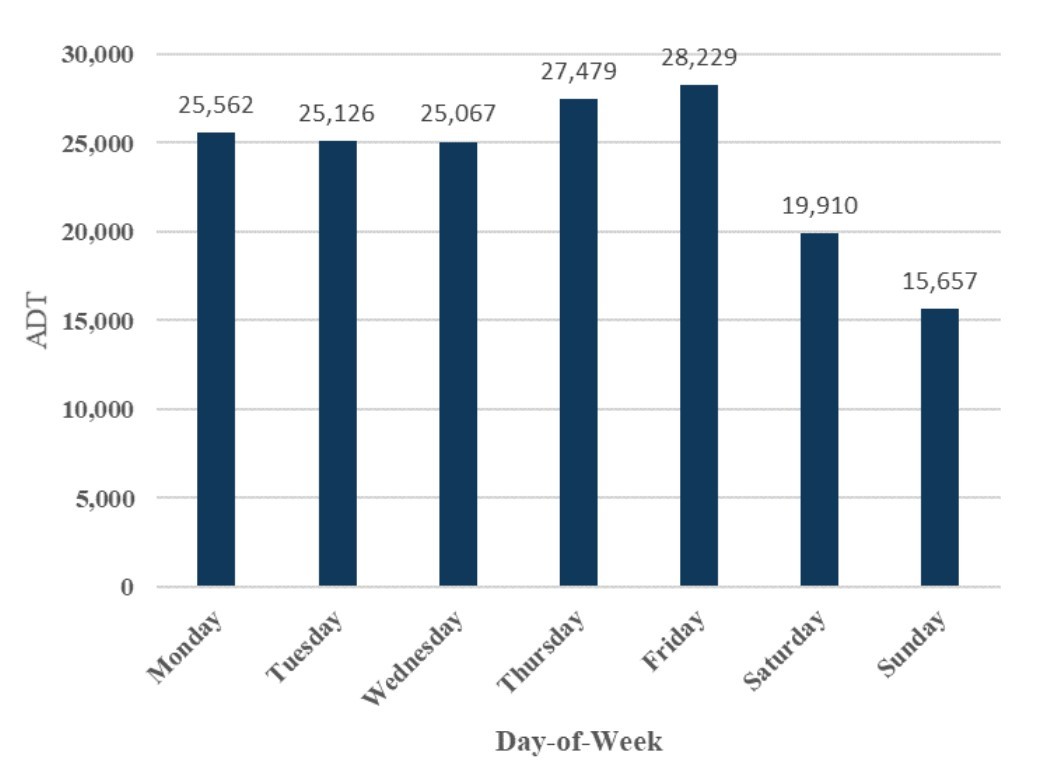
Figure 2-1: Example Segment Traffic Count Corridor Profile
Suggested segment traffic data collection method:
- 15-minute increments;
- Typical week; and
- Seven to 14 consecutive days for projects needing microsimulation on IAJR projects; one to two days for other projects
2.2.3.3 Classification Counts
Classification counts determine the breakdown of the 13 FHWA vehicle categories, per the TxDOT Traffic Recorder Instruction Manual. Classification counts are similar to segment traffic counts and include two-way traffic volumes on a roadway for a specified period of time greater than 24 hours but less than a year. Classification counts help determine the percentage of different vehicle categories using a roadway, which is important in performing traffic operational analysis and pavement design. It is suggested that classification counts be conducted during a typical week for a period of seven consecutive days for projects needing microsimulation on an IAJR project. Classification counts are to be conducted for a minimum of 48-hours for other projects, based on coordination with the TxDOT project manager. For locations where classification counts are performed in place of segment traffic counts, it is suggested the segment traffic collection method be used.
Suggested classification counts collection method:
- 15-minute increments;
- Typical week; and
- Minimum seven consecutive days for microsimulation on IAJR projects; one to two days for other projects
2.2.3.4 Oversaturated Counts
Oversaturated conditions occur when the demand for the facility exceeds the capacity. These conditions result in a significant drop in speeds and flow rate through a point or segment, depending on the severity of saturation. The HCM defines conditions as oversaturated when any of the following conditions are satisfied:
“(a) the arrival flow rate exceeds the capacity of a point or segment, (b) a queue created from a prior breakdown of a facility has not yet dissipated, or (c) traffic flow is affected by downstream conditions.”
For uninterrupted flow, oversaturated conditions result from a bottleneck on the facility. During oversaturated conditions, queues extend upstream from the point of the bottleneck.
It is recommended that traffic counts collected for oversaturated conditions span a time interval greater than just the peak hour or peak period. It is suggested that field observations are conducted, along with segment traffic counts, to determine the overall peak period and the shouldering effect of traffic or queue build up and dissipation. A shouldering effect occurs during a peak period when a facility is oversaturated and cannot process any additional demand, causing the peak period to extend longer than an hour. The effect can occur on both ends of the peak hour during a peak period, where the demand for the facility is higher than the capacity, allowing only a portion of the traffic volumes to process through the facility until the demand falls below capacity.
For oversaturated and bottleneck conditions, it is suggested that counts are started at least one hour before congestion starts and end one hour after congestion has been cleared. Similar to TMCs, oversaturated counts are collected on a typical weekday and for a minimum of two consecutive days, based on coordination with the TxDOT project manager. Depending on how congested the study area is, collect counts at least one intersection or interchange upstream of the study area.
In addition to traffic counts, it is recommended that queue data is collected for oversaturated conditions, depending on the type of analysis being performed. See
Section 2.2.4 - Queue Data
for calculating demand in oversaturated conditions.Recommended oversaturated counts collection method:
- 15-minute increments;
- Typical weekday peak period (Tuesday, Wednesday, Thursday);
- Include the shouldering effect of traffic
- Begin counts at a minimum one hour before congestion starts and end at a minimum one hour after congestion dissipates
- Collected at least one intersection or interchange upstream of the congested study area or other logical terminus determined through engineering judgement; and
- Collected for two consecutive weekdays
2.2.4 Queue Data
Queue data is recommended for oversaturated conditions. Traffic count data documents the volume processed at an intersection or at a cross-sectional point on a road but not necessarily the demand. In oversaturated conditions, the volume served at an intersection or at a cross-sectional point on a road may be lower than the overall demand. It is recommended that queue data be collected for oversaturated approaches or roadway segments within the study limits. If the queues extend past the study limits, collect data upstream, past the longest queues. For severely congested corridors with extremely long queues extending past the study area, engineering judgement would be used to determine where to set study limits and data collection locations for queues.
Queues are often measured in terms of arrival and departure volumes at a given facility. Counts are typically conducted in five-minute intervals, starting before the existence of any congestion or queues at the location and ending after all queues have been cleared from the facility. The resultant queue is defined as the difference between the five-minute arrivals and departures, and arrival data is counted upstream of the longest expected queue.
Complementary ways to determine queues include conducting license plate studies; using probe-based data to look at speeds, automated traffic recorders (ATR), segment counts, travel times, and bottleneck locations; and conducting field observations or scanning Google Maps for congestion. Google Maps provides live traffic data as well as typical historical congestion levels. This may be used to get a general understanding of queues. It is recommended to perform field observations to supplement the data collected via Google Maps.
2.2.5 Speed, Travel Time, and OriginDestination (OD) Data
Speed is a fundamental MOE for traffic operational analysis. Speed is measured in two ways: time-mean-speed (TMS) and spacemean-speed (SMS). TMS is calculated by recording the speeds of individual vehicles passing a point over a selected period of time. SMS is calculated by dividing the average travel time by the distance of that route. This is an important distinction, as some methods of collections use TMS, while others use SMS; this difference can lead to different speeds for the area of interest, if not carefully distinguished. TMS is typically used when the speed at a point is of most interest, and the SMS is used when the speed over a section of roadway is of most interest. SMS is also used when analyzing and reducing travel time data.
Travel time is the time to traverse a route from point A to point B and is a fundamental MOE for traffic engineering.
OD data is also another important traffic characteristic that may be helpful in determining travel patterns. OD datasets provide information on trips between userdefined geographic zones or roadways. These datasets may also have additional information related to the mode of transportation, such as organizing data by pedestrians, bicyclists, and freight.
Additional information about Probe-Based Data, Bluetooth Sensors Data, and Floating Cars Data is shown in this section. This additional information provides guidance on the different methods of collections for speed, travel time, and OD data.
2.2.5.1 Probe-Based Data
Probe-based data is collected from individual vehicles, or probes, over space and time, rather than collected at a specific place and time. The most common types of probe-based data collection methods are Automatic Vehicle Location (AVL), Global Positioning System (GPS) mobile devices, and third-party cell phone app data. This data is typically collected by thirdparty companies that parse through the data, anonymize it, and convert individual probe data into performance measures such as speed, travel time, and OD. This data is then used for traffic analysis. The data can also be used to determine OD of trips and queuing.
Floating car data (FCD) is a type of probebased, timestamped, geospatial data that provides speeds and travel times. The data is collected by using an application or a GPS device that records timestamps and geospatial data while the application or device is driven through the area of interest. The driver attempts to “float” in the traffic stream, selecting a location in the traffic flow where the vehicle’s speed matches that of the surrounding vehicles to allow the probe to collect data of a typical vehicle along the facility during the analysis period. FCD is recommended to be collected on typical weekdays (Tuesday, Wednesday, Thursday) and during the peak period. A minimum of five runs in each direction per peak period are typically performed for a more representative view of existing traffic conditions, as demonstrated by . FCD provides a sample of the existing congestion, speeds, stops, and travel times for the study area during a peak period.
TxDOT has access to probe-based data, such as INRIX, which can be used for traffic analysis. See
Section 2.3 Existing Traffic Operations Data Sources
in this chapter for more information.2.2.5.2 Bluetooth Sensors Data
Bluetooth sensor data is like probe-based data but is more localized and needs specialized hardware. Most vehicles manufactured today are equipped with Bluetooth devices, as are personal electronics such as phones, laptops, and tablets. Bluetooth sensors used for traffic engineering scan for other Bluetooth-enabled devices near the Bluetooth sensor device. Once a device is read by the Bluetooth sensors, it stores data related to the detected device. This data can be used to conduct OD studies, determine vehicular density, and conduct flow analysis. When using Bluetooth sensors for traffic engineering, the placement of these sensors is key. Placing these sensors under overpasses, or where multiple roadways are crossing over or under each other, may create challenges, such as not being able to identify the overpass or roadway on which the device was read. This can also occur at intersecting roadways with many pedestrians with cellphones. Post-processing of this data to minimize such issues is suggested. This method only gathers information for vehicles with Bluetooth devices present in the vehicle.
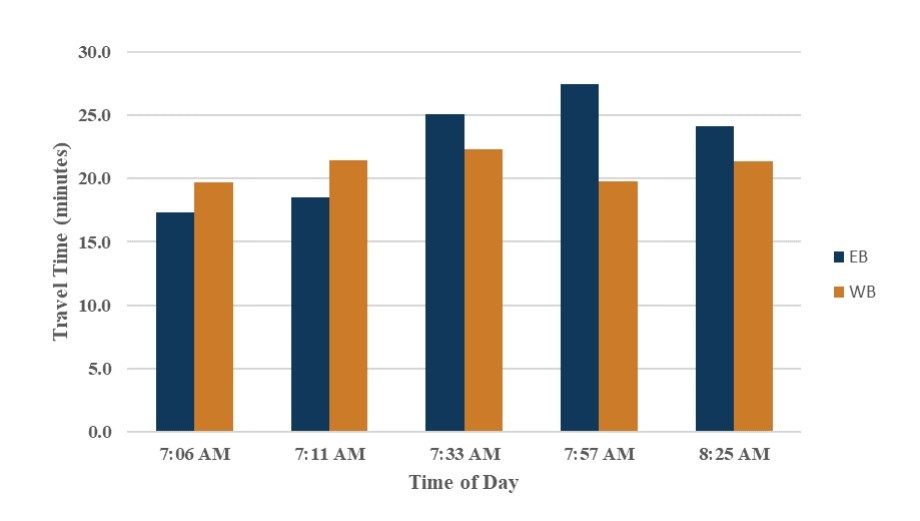
Figure 2-2: Floating Car Travel Time Runs
2.2.6 Multimodal Travel Data
Multimodal analysis involves considering other modes of transportation, such as pedestrians, bicyclists, transit, and freight. This subsection provides a list of the different data types that are often used to conduct analysis on different modes of transportation. For additional analysis-specific data requirements not covered in this subsection, see
Chapter 14 – Multimodal Analysis
.Pedestrian and Bicycle Data Types
- Pedestrian counts taken at defined location;
- Bicycle counts;
- Scooter counts;
- Sidewalk location, length, and discontinuity, if any;
- Sidewalk width;
- Sidewalk and pavement condition;
- Buffer type;
- Posted speed;
- Type of facility (e.g., shared-use path, buffered bike lane);
- Pedestrian/bicycle facility surface type;
- Average Daily Traffic (ADT) on an adjacent roadway facility;
- Parking type (e.g., parallel, angled, back in);
- Adjacent land use; and
- Number of lanes on adjacent roadway facility
Transit Data Types
- Route;
- Service type (e.g., light rail, bus rapid transit);
- Number and location of stops (i.e., passenger boarding and alighting locations);
- Dwell time at stops; and
- Frequency and headway
Freight Data Types
- Passenger car equivalents;
- Truck traffic percentage;
- Tonnage;
- Commodity type;
- Freight warehouses, distribution facilities or ports that generate truck traffic;
- Location of railroad crossings; and
- Truck types
2.2.7 Safety Data
It is recommended that safety data is used to complete a safety analysis. Safety data often includes crash records, geometrical features of a roadway facility, proposed safety improvements to a roadway, and roadway characteristics such as ADT. Please see
Section 2.2.1
and 2.2.3
for more information related to collecting geometric data and segment traffic counts. Additional information regarding data collection needs for safety and crash analysis is included in Chapter 5
and Chapter 6.
The intent of gathering safety data is to complete a historical or predictive safety analysis that identifies potential locations to improve safety.