14.2.2 Bicycle
Selecting the correct methodology or tool for bicycle analysis depends on several factors such as bicycle facility type, anticipated vehicular delay caused by bicycle facilities, and desired performance measures. A bicycle analysis methodology selection flowchart is provided in to guide in the selection of bicycle analysis methodologies. Refer to TxDOT’s RDM Chapter 6, Section 4 for information on bicycle facility design.
The bicycle analysis subsection methodology is based on the following resources/tools (key notes are provided under each resource):
The bicycle analysis subsection methodology is based on the following resources/tools (key notes are provided under each resource):
- HCM and the HCS;
- Provides limited information for bicycle analysis methodologies
- Methodologies emphasize bicycle crossings at signalized intersections and bicycle travel speed
- This chapter emphasizes using the application of the HCM methodologies as seen in the HCS (i.e., signalized intersections and urban street segments)
- BLTS;
- This methodology is from the Mineta Transportation Institute’s 14-17 2024 | Traffic and Safety Analysis Procedures Manual BLTS Report 11-19, May 2012 and is comparable to an assessment in which various bicycle accommodations are classified based on safety, comfort, and connectivity criteria
- Microsimulation; and
- Guidelines on when to use microsimulation for bicycle analysis
- This methodology is used to provide animations and analyze the interaction between bicycles and vehicles, but it does not analyze the perceived safety and comfort of bicycle accommodations
- Various Safety Guidelines
- External resources that are used for bicycle facility improvements via countermeasure selection and scenario-specific enhancements
- The future of predictive safety analysis for bicycle accommodations
- See for various bicycle facilities and their descriptions
Type | Definitions/Descriptions |
|---|---|
Shared Lane (Mixed Traffic) | Bicycles and vehicular traffic operate in the same space |
Bicycle Lane (may or may not have a buffer) | A bicycle lane is an on-street bicycle accommodation that gives bicycles defined ROW within certain areas. This includes paved shoulders. |
Sidepath | Sidepaths are off-street bicycle accommodations. |
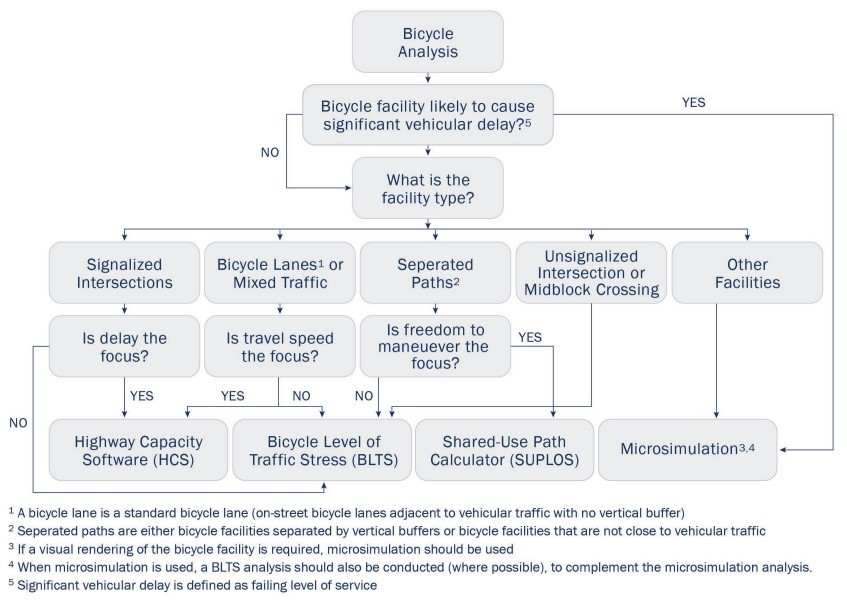
Figure 14-3: Bicycle analysis tool/methodology selection flowchart
14.2.2.1 The HCM
The HCM-based software, HCS is best for bicycle analysis scenarios, as depicted in .
The HCM contains methodologies for several bicycle facility types (see ), but the HCS only analyzes urban street segments and signalized intersections. For street segment analysis, the HCM uses bicycle travel speed as a major factor to determine LOS. As such, it is recommended that the HCM methodology for street segment analysis only be considered for bicycle accommodations with high volumes of bicyclists (e.g., central business districts, mixed-use developments, tourist destinations, outdoor shopping centers). It is recommended to use HCS (or another similar software tool) for analysis of bicycle accommodations at signalized intersections. LOS D is recommended as a minimum target for signalized crossings and street segments.
Facility Type | HCM Chapter and Section Number |
|---|---|
Urban street facilities | 16.5 |
Urban street segments | 18.5 |
Signalized intersections | 19.6 |
Two-way stop-controlled intersections | 20.6 |
All-way stop-controlled intersections | 21.6 |
Roundabouts | 22.6 |
Ramp terminals and alternative intersections | 23.B.4 |
Off-street facilities | 24.3 |
While bicycle analysis can be conducted by hand for other accommodations covered in the HCM (i.e., accommodations besides urban street segments and signalized intersections), it is recommended to use BLTS analysis for these other accommodations.
To conduct a bicycle analysis of signalized intersections, the inputs shown below are collected and entered into the corresponding fields on the “Bicycle Mode - Signals” section of the Multimodal Input Data on HCS. Definitions of multimodal inputs are provided in the HCS User Guide. Traffic inputs for the intersection will impact LOS calculations for the analysis and are also entered.
- On-street parking occupied, proportion;
- Curb-to-curb street width, ft;
- Outside through lane width, ft;
- Bicycle lane width, ft;
- Paved shoulder width, ft; and
- Presence of curb
To conduct a bicycle analysis of urban street segments, the inputs shown below are collected and entered on the “Bicycle Mode - Streets” section of the Multimodal Input Data on HCS. Definitions of multimodal inputs are provided in the HCS User Guide. To view results, print the “segments report” found in the HCS.
- Bicycle running speed, mi/h;
- Percent heavy vehicles;
- Total number of access points; and
- Pavement condition rating
14.2.2.2 Bicycle Level of Traffic Stress (BLTS)
BLTS is used for bicycle analysis scenarios as described in .
A BLTS analysis is conducted by taking inventory of existing/proposed bicycle accommodations. The inventory gathers relevant information about each bicycle facility (e.g., bike lane width, on-street parking width, through lanes per direction, etc.). Inventory data is then compared to predefined BLTS classifications for each roadway characteristic and used to assign each facility an overall BLTS classification. A BLTS classification is a ranking that describes safety, comfort, and convenience (see ). The steps for a BLTS analysis are shown in . Detailed steps on conducting a BLTS analysis are provided on the next page
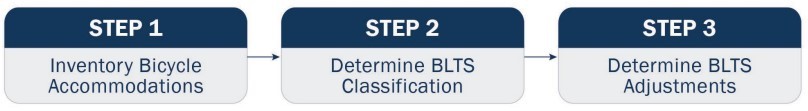
Figure 14-4: Steps in a BLTS analysis
The intent of a BLTS analysis is to determine individual bicycle facility deficiencies or connectivity gaps in a network to prioritize bicycle facility improvements. It can be used at any stage in the project development. At the planning level, it can be used to determine priority locations for improving bicycle accommodations. At the design level, it can be used to determine specific facility needs such as wider bicycle lanes, bicycle lanes separated by a buffer, or vertical feature, etc.
A BLTS analysis does not analyze capacity, travel times, or delay, but does analyze safety, comfort, and connectivity based on facility design.
The four BLTS classifications are BLTS 1 (the best rating), BLTS 2 (the minimum standard for most bicycle accommodations), BLTS 3 (the first failing rating), and BLTS 4 (the worst rating). The four classifications and their definitions are shown in .
Classification | Characteristics |
|---|---|
BLTS 1 | Bicycle accommodations with this classification have little to no traffic stress. They are perceived as safe, open, and comfortable. Accommodations are often separated from motor vehicles by a buffer or vertical feature or are adjacent to roads with low speeds and low volumes. These accommodations are suitable for all abilities and ages. This is the best classification. |
BLTS 2 | Bicycle accommodations with this classification have a small level of traffic stress. They can be adjacent to motor vehicles and speeds higher than BLTS 1. These accommodations are suitable for most ages and abilities. This is the minimum standard for most pedestrian facilities. |
BLTS 3 | Bicycle accommodations with this classification represent accommodations with a medium level of traffic stress. These accommodations are often adjacent to motor vehicles and can be mixed bicycle traffic flow. Vehicle speeds and volumes are higher. These accommodations are suitable for some able-bodied adults. This is the first failing classification. |
BLTS 4 | Bicycle accommodations with this classification represent accommodations with the highest levels of traffic stress. They are often exclusively mixed traffic accommodations with high vehicle speeds and volumes. These accommodations are only suitable for highly confident able-bodied adults. This is the worst classification. |
14.2.2.2.1 Step One: Template Selection and Data Collection for Bicycle Accommodations
The BLTS Inventory and Classification template (provided in
Appendix O, Section 3 – BLTS Inventory and Classification
) has four tables based on facility type:- One for bicycle accommodations that are adjacent to vehicular traffic (with or without buffers);
- One for mixed traffic bicycle accommodations;
- One for bicycle accommodations at intersection approaches; and
- One for unsignalized intersection crossings or midblock crossings
This fillable template will serve as the basis for analysis and contains information on data needs, reference tables used in the analysis, and fillable boxes to input information.
Once the correct table on the BLTS Inventory and Classification template is selected, collect data for the bicycle facility in question. Use the BLTS Inventory and Classification template discussed previously to list all collected data. Characteristics to inventory depend on the facility type and are shown here:
- Separated bicycle lanes
- Separated by proximity (e.g., bicycle lane is completely disconnected from vehicular traffic) or separated by a large vertical barrier (e.g., a large vertical feature between bicycle lane and vehicles)
- BLTS 1 classification is recommended with no further analysis
- Bicycle lanes adjacent to vehicular traffic (does not include bicycle lanes separated by a large vertical barrier)
- Posted speed
- Through lanes per direction
- Bicycle lane width
- On-street parking width (if applicable)
- See or for applicability criteria
- Mixed traffic bicycle accommodations (bicycles and vehicular traffic share the road)
- Posted speed
- Through lanes per direction
- Bicycle accommodations at intersection approaches
- Generally, if more than 80 percent of bicyclists use signalized intersection crosswalks instead of crossing via bicycle lanes or vehicular lanes, a BLTS 1 classification can be given, and no further data collection or analysis is recommended
- Posted speed
- Right-turn length (if applicable)
- A measure of how many vehicles use the right-turn lane (i.e., the longer the right-turn lane, the more people that use it)
- Right-turn length is a substitute for TMCs at an intersection
- or for applicability criteria
- Lanes crossed to reach left-turn lane (if applicable)
- See for applicability criteria
- Unsignalized intersection crossing or midblock crossings
- Posted speed on adjacent vehicular roadway
- Number of adjacent roadway lanes
- For roadways without a median refuge
- footnote 1 for adjacent roadway lanes definition
- For roadways with a median refuge
- See or footnote 1
14.2.2.2.2 Step Two: Determine BLTS Classification
Use the data gathered from the facility inventory and the relevant BLTS classification tables shown on the
BLTS Inventory and Classification Template
(see Appendix O, Section 3 – BLTS Inventory and Classification
) to determine a BLTS classification. The BLTS classification reference tables are also shown in . The preliminary BLTS classification is written down on the BLTS Inventory and Classification template. Determining the overall BLTS classification of the facility occurs in Step 3
, this step is a preliminary determination of BLTS classification.Facility Type | Tables Used to Determine PLTS |
|---|---|
Bicycle lanes that are adjacent to vehicular traffic (does not include bicycle lanes that are adjacent to vehicular traffic but are separated by a large vertical barrier) |
|
Mixed traffic bicycle accommodations |
|
Bicycle accommodations at intersection approaches |
|
Bicycle accommodations at unsignalized intersection crossings or midblock crossings |
|
A bicycle route can be comprised of several individual bicycle accommodations (e.g., a segment of bike lane not disconnected from vehicular traffic, a segment of mixed traffic bicycle accommodations, and a bicycle facility at an intersection approach). If this is the case, data is collected for each facility and a BLTS classification assigned to each facility separately in preparation for the overall facility BLTS classification.
Posted Speed | 1 Lane Per Direction | ≥2 Lanes Per Direction | ||
|---|---|---|---|---|
≥15-ft bicycle lane + parking width | 14-14.5-ft bicycle lane + parking width | ≤13.5-ft bicycle lane + parking width 2 | ||
≤25 | BLTS 1 | BLTS 2 | BLTS 3 | BLTS 3 |
30 | BLTS 2 | BLTS 2 | BLTS 3 | BLTS 3 |
35 | BLTS 3 | BLTS 3 | BLTS 3 | BLTS 3 |
≥40 | BLTS 4 | BLTS 4 | BLTS 4 | BLTS 4 |
1
Applicable to bicycle accommodations that are adjacent to on-street parking 2
Use this column if bicycle lane blockage is commonPosted Speed | 1 Lane Per Direction | 2 Lanes Per Direction with Raised Median | ≥2 Lanes Per Direction or No Raised Median | |
|---|---|---|---|---|
≥6-ft bicycle lane width | ≤5.5-ft bicycle lane width | |||
≤30 | BLTS 1 | BLTS 2 | BLTS 2 | BLTS 3 |
35 | BLTS 3 | BLTS 3 | BLTS 3 | BLTS 3 |
≥40 | BLTS 4 | BLTS 4 | BLTS 4 | BLTS 4 |
1
Applicable to bicycle accommodations that are not adjacent to on-street parkingPosted Speed | Unmarked Centerline | 1 Through Lane Per Direction | 2 Through Lanes Per Direction | ≥3 Through Lanes Per direction |
|---|---|---|---|---|
≤20 | BLTS 1 | BLTS 1 | BLTS 3 | BLTS 3 |
25 | BLTS 1 | BLTS 1 | BLTS 3 | BLTS 3 |
30 | BLTS 2 | BLTS 2 | BLTS 3 | BLTS 4 |
35 | BLTS 2 | BLTS 2 | BLTS 3 | BLTS 4 |
40 | BLTS 4 | BLTS 4 | BLTS 4 | BLTS 4 |
≥45 | BLTS 4 | BLTS 4 | BLTS 4 | BLTS 4 |
Posted Speed | ≤150-ft Right-Turn Lane Length | >150-ft Right-Turn Lane Length | Other 3 |
|---|---|---|---|
≤25 | BLTS 1 | BLTS 2 | BLTS 4 |
30 | BLTS 2 | BLTS 3 | BLTS 4 |
35 | BLTS 3 | BLTS 3 | BLTS 4 |
≥40 | BLTS 3 | BLTS 4 | BLTS 4 |
1
Only applicable when bicycle accommodations interact with right-turn lanes at an intersection approach 2
Pocket bicycle lanes are bicycle lanes positioned between a right-turn lane and a through lane at an intersection 3
Scenarios in this category include dual right-turn lanes, or a right turn and shared through-right combinationPosted Speed | ≤75-ft Right-Turn Lane Length | 75 – 150-ft Right-Turn Lane Length | >150-ft Right-Turn Lane Length |
|---|---|---|---|
≤25 | BLTS 1 | BLTS 1 | BLTS 2 |
30 | BLTS 1 | BLTS 2 | BLTS 3 |
35 | BLTS 2 | BLTS 3 | BLTS 4 |
≥40 | BLTS 3 | BLTS 4 | BLTS 4 |
1
Only applicable when bicycle accommodations interact with right-turn lanes at an intersection approachPosted Speed | No Lane Crossed | 1 Lane Crossed | ≥2 Lanes Crossed | Other |
|---|---|---|---|---|
≤25 | BLTS 2 | BLTS 3 | BLTS 4 | BLTS 4 |
30 | BLTS 3 | BLTS 4 | BLTS 4 | BLTS 4 |
≥35 | BLTS 4 | BLTS 4 | BLTS 4 | BLTS 4 |
1
Only applicable when bicycle route can turn left and uses left-turn lane instead of two stage crossing at signalized crosswalksPosted Speed | Adjacent Roadway Lanes 1 | |||||
2 Lanes | 3+ Lanes | |||||
<5,000 vpd | 5,000 – 9,000 vpd | >9,000 vpd | <8,000 vpd | 8,000 – 12,000 vpd2 | >12,000 vpd | |
≤25 | BLTS 1 | BLTS 1 | BLTS 2 | BLTS 3 | BLTS 3 | BLTS 4 |
30 | BLTS 1 | BLTS 2 | BLTS 3 | BLTS 3 | BLTS 3 | BLTS 4 |
35-40 | BLTS 2 | BLTS 3 | BLTS 4 | BLTS 3 | BLTS 4 | BLTS 4 |
≥45 | BLTS 3 | BLTS 4 | BLTS 4 | BLTS 4 | BLTS 4 | BLTS 4 |
1
For bicycle accommodations that are unsignalized intersection crossings or midblock crossings without a median refuge, this is the total number of lanes on the segment (e.g., a roadway with two lanes in each direction and a two-way left turn lane would have an adjacent lane value of 5) 2
Use this column when ADT is unavailablePosted Speed | Adjacent Roadway Lanes 1 | |||
1 Lane | 2 Lane | |||
Any | <5,000 vpd | 5,000 – 9,000 vpd2 | >9,000 vpd | |
≤25 | BLTS 1 | BLTS 1 | BLTS 2 | BLTS 2 |
30 | BLTS 2 | BLTS 2 | BLTS 2 | BLTS 2 |
35-40 | BLTS 2 | BLTS 2 | BLTS 2 | BLTS 3 |
≥45 | BLTS 3 | BLTS 3 | BLTS 3 | BLTS 4 |
1
For bicycle accommodations that are unsignalized intersection crossings or midblock crossings with a median refuge, this is the maximum number of lanes crossed in one direction (e.g., a roadway with two lanes in each direction would have an adjacent roadway lane value of 2) 2
Use this column when ADT is unavailablePosted Speed | Adjacent Roadway Lanes 1 | |||
|---|---|---|---|---|
3 Lanes | 4+ Lanes | |||
<8,000 vpd | 8,000 – 12,000 vpd2 | >12,000 vpd | Any | |
≤25 | BLTS 1 | BLTS 2 | BLTS 3 | BLTS 4 |
30 | BLTS 2 | BLTS 2 | BLTS 3 | BLTS 4 |
35-40 | BLTS 3 | BLTS 3 | BLTS 4 | BLTS 4 |
≥45 | BLTS 4 | BLTS 4 | BLTS 4 | BLTS 4 |
1
For bicycle accommodations that are unsignalized intersection crossings or midblock crossings with a median refuge, this is the maximum number of lanes crossed in one direction (e.g., a roadway with two lanes one direction and three lanes in the other direction would have an adjacent roadway lane value of 3) 2
Use this column when ADT is unavailable14.2.2.2.3 Step Three: Determine BLTS Adjustments
As stated previously, separated bicycle lanes and bicyclists using pedestrian crossings at signalized intersection crosswalks are classified as BLTS 1.
For bicycle accommodations that are not separated, accommodations that are mixed traffic bicycle accommodations, and accommodations at intersection approaches, use the BLTS classification designated in step two. For bicycle accommodations that are unsignalized intersection crossings or midblock crossings, use the overall BLTS classification determined in step two, adjusted for any crosswalk enhancements. The crosswalk enhancement adjustments are shown in .
Treatment 1 | Adjustment |
|---|---|
High-visibility crosswalk markings, parking restrictions on crosswalk approach, adequate nighttime lighting levels, and crossing warning signs | -0.5 |
Raised crosswalk | -1.0 |
Advance Yield Here To (Stop Here For) bicycle sign and yield (stop) line | -0.5 |
In-street bicycle crossing sign | -0.5 |
Curb extension | -0.5 |
Bicycle refuge island | -1.0 |
RRFB | -1.0 |
PHB | -1.0 |
1
The maximum reduction is 2 classification levels or BLTS 2, whichever comes firstIf a bicycle route is comprised of multiple accommodations, the BLTS classification with the highest level of traffic stress governs the entire route (e.g., a route comprised of a BLTS 2 bicycle lane, a BLTS 3 intersection approach, and a BLTS 4 midblock crossing would receive a BLTS 4 classification).
Examples
of a completed inventory and BLTS classification for an on-system bicycle facility are shown in and . In the first
example
shown in , the bicycle facility was a bicycle lane between intersections. The first step was to determine which inventory and classification template table to use (see Appendix O, Section 3 – BLTS Inventory and Classification
). The upper table in the BLTS Inventory and Classification Template was used based on the footnote at the bottom of the table that states, “Applicable to bike accommodations that are adjacent to vehicular traffic”. Next, an inventory was conducted for the facility in question, the collected data was based on the BLTS Inventory and Classification Template
chosen, and for this example included the following data:- Bike lane width;
- Determined to be five feet
- On-street parking width;
- Determined that it is not applicable for this facility
- Through lanes per direction; and
- Determined to be one
- Posted speed
- Determined to be 35 mph
The collected data was used to determine the BLTS classification of the facility based on a single reference table. It is important to select the correct table. Although there are two reference tables on the BLTS Inventory and Classification template table, only one is selected, based on if the facility is adjacent to on-street parking. In this
example
, there is no on-street parking, so was used to determine the BLTS classification. Based on , a bicycle accommodation adjacent to vehicular traffic with a five-foot bicycle lane width, a 35-mph speed limit, and one through lane of vehicular traffic per direction is given a BLTS 3 classification. This type of facility is not eligible for treatment reductions, therefore the final classification of this facility is BLTS 3. In part 2 of this example
(see ), the next portion of this bicycle route will be inventoried. Although a BLTS 3 classification was given to this facility, if other portions of the route are classified inferior, they will govern the entire route.Facility: Bicycle Lane between intersections | |||
Characteristic | Value | BLTS Reference Table | BLTS Classification |
Bike lane width (ft) | 5 | Table 14-23 | BLTS 3 |
On-street parking width (ft) | Not applicable | ||
Through lanes per direction | 1 | ||
Posted speed (mph) | 35 | ||
In the second
example
shown in , the bicycle facility was a bicycle lane at an intersection approach. The first step was to determine which inventory and classification template table to use (see Appendix O, Section 3 – BLTS Inventory and Classification
). The third table from the top in the BLTS Inventory and Classification Template was used based on the footnote at the bottom of the table that states, “Applicable to bicycle facilities at intersection approaches.” It was determined that most bicyclists cross the intersection on the bike lane and do not use the pedestrian crosswalk. Next, an inventory was conducted for the facility in question, the collected data was based on the BLTS Inventory and Classification Template
chosen, and for this example included the following data:- Right-turn length;
- Determined to be 200 feet
- Number of lanes crossed; and
- Determined to be four
- Posted Speed
- Determined to be 35 mph
The collected data was used to determine the BLTS classification of the facility based on a single reference table. Although there are three reference tables on the BLTS Inventory and Classification template, only one is selected, based on if the facility is for a through-right movement or left turn and if the facility is mixed with traffic or if there is a bike lane. In this
example
, this is a through-right movement and is in mixed traffic, so was used to determine the BLTS classification. Based on , a bicycle accommodation that approaches an intersection with a 200-foot right turn lane, crosses four lanes through the intersection, and has a posted speed of 35 mph is given a BLTS 4 classification. This type of facility is not eligible for treatment reductions, therefore the final classification of this facility is BLTS 4. Example 1 (Part 1) resulted in a BLTS 3 classification for the facility and example 1 (part 2) resulted in a BLTS 4 classification for the facility. Since the two facilities are on the same route, the overall route classification is BLTS 4 (i.e., the worse of the classifications).Facility: Bicycle Lane at intersection approach | |||
|---|---|---|---|
Characteristic | Value | BLTS Reference Table | BLTS Classification |
The Shared-Used Path Level of Service (SUPLOS)
calculator is used for bicycle analysis scenarios as described in. This tool is mainly used to evaluate bicycle mobility. Though the results of using this calculator will likely improve conditions for all modes on the path, it was designed from the bicyclist’s point of view. It was created with the following usage criteria:
- The tool is for shared paths with paved hard surfaces (e.g., asphalt or concrete).
- The tool uses the following modes as inputs:
- Adult bicyclists
- Pedestrians
- Runners
- In-line skaters
- Child bicyclists
- The tool is not applicable to trails with stop signs, signal controls, or road crossings with spacing less than 0.25 miles apart.
- The tool is best suited for two-way shared-use path facilities. It does not apply to on-street bicycle facilities.
Links to the SUPLOS calculator and user guide are provided in
Appendix O, Section 4 – Shared-Use Path Level of Service Calculator Guidance.
14.2.2.3 Microsimulation
Microsimulation is used for bicycle analysis scenarios as described in .
Animations of bicycle accommodations can be created with microsimulation (microscopic) tools and are a valuable resource in bicycle analysis. Animations are not necessary for any bicycle facility analysis but could be recommended based on project complexity and level of detail. Animations are not acceptable as a standalone form of analysis and are recommended to be used only as a complement to a BLTS, HCS, or traditional microsimulation (microscopic) analysis.
Microsimulation can be used if the bicycle facility interacts with motor vehicles and if there are significant delays. Microsimulation does not analyze safety or perceived comfort of a bicycle facility, so a microsimulation (microscopic) analysis is paired with a BLTS analysis wherever possible (i.e., for all facility types except signalized intersections, alternative intersections or interchanges, and high-volume urban street segments).
For general guidance on conducting a microsimulation (microscopic) analysis, see
Chapter 13
. If using Vissim to conduct a bicycle analysis, refer to the Vissim user manual for information on specific best practices and guidance.
14.2.2.4 Safety
In addition to the safety emphasis found in the BLTS analysis, additional resources on bicycle facility safety are provided
in Appendix O
, Section 2 – Pedestrian and Bicycle Safety Resources
. It contains information about countermeasure selection tools and crash analysis tools for bicycle accommodations. The document also lists many external reports that focus on bicycle safety at various accommodations and scenarios. While predictive safety analysis for bicycle accommodations is limited as of 2024, NCHRP Report 1784 is developing crash prediction model SPFs for use in the Second Edition of the HSM. For further information on the application of the HSM and other safety topics, see
Chapter 5
and Chapter 6
. Additionally, TxDOT Research and Technology Implementation is sponsoring a research project to address bicycle safety through the development of CMF for bicycle accommodations.