10.3 Intersection Control Evaluation – Process and Analysis
10.3.1 ICE Process Overview and Reporting
The two-stage ICE study procedure is beneficial for intersection analysis of intersection modification, reconstruction or where new construction is planned.
In Stage 1 the intersection analysis is a streamlined combination of operations and safety components:
- Operational analysis using CAP-X and TMUTCD warrants; and
- Safety analysis using SPICE
See
Appendix K, Section 3 – Intersection Analysis Checklist
for an intersection analysis checklist. An expanded checklist is also provided for non-ICE type studies and system optimization considerations.The main tools used in intersection analysis at Stage 1 are TMUTCD warrants (two-way stop controlled, AWSC, and signalized intersection), SPICE and CAP-X are considered sketch-level or macroscopic tools. Sketch-level or macroscopic analysis tools are typically used in analyzing individual intersections and large projects with interchanges or corridors, without requiring extensive resources. CAP-X is a pass-fail tool and not a ranking tool. The CAP-X LOS results are not granular enough to rank alternatives. Conversely, SPICE, in Stage 1, can be used as a ranking tool for all intersection control alternatives.
Stage 1 ICE considers all intersection control alternatives, ranks and removes the alternatives that do not meet the project’s purpose and needs based on existing conditions, field observations, and analyzed data. Conceptual exhibits of some intersection designs, such as roundabouts, help to determine the footprint and space needed. See
Chapter 8
for additional information on alternatives analysis. Engineering judgement and a series of questions are considered during this determination. Does the alternative:- Meet the specified project goals and needs in a practical way?
- Meet the applicable warrants?
- See warrants for TWSC, AWSC, and signalized intersections below.
- Address known crash history or improve future safety?
- Demand additional ROW, and if so, how feasible will it be to acquire it?
- Demand railroad coordination for ROW or encroachment?
- Meet the TxDOT standards for turn-bay length?
- Provide adequate left-turn capacity?
- Have any known environmental impacts or produce higher emissions?
- Provide a sustainable solution that is context-sensitive to any long-range plans and improvements?
- Address stakeholder and public areas of interest?
- Foster error-free driving tasks?
Stage 2 ICE applies more rigorous analysis of geometry, safety and operations, along with Traffic and Safety Analysis Procedures Manual | 2024 10-16 other factors such as cost and impacts (utilities, ROW, environmental, etc.). The main tools used in Stage 2 operations analysis are Synchro, HCS, and Vissim. The analysis software tool selection is based on intersection type, project complexity, and object level of detail (see ) for recommended analysis tools. The analysis tools recommended are example tools and other comparable software can be used. HCM-based (mesoscopic) tools are typically used when a more detailed analysis is necessary, but microsimulation (microscopic) analysis would be too much detail. Information related to the capabilities of the software is found in
Chapter 4 and Chapter 12, Appendix M
. Appendix K, Section 1
provides an abbreviated version of an ICE report. It covers the Stage 1 requirements and generates a preferred type of intersection control without requiring more detail that Stage 2 typically generates. When both the safety (SPICE) and operations (CAP-X) analyses generate a clear preference for intersection control during the Stage 1 study tasks, Stage 2 ICE investigation may not be necessary, and the project can proceed to schematic design and detailed cost estimation. ICE Stage 2 is necessary when a clear preference for safety improvement is not evident in Stage 1, or where more detailed operational or impacts analysis is needed, such as where intersections are closely spaced.
10.3.2 Stage 1 Operational Performance and ICE
CAP-X is a spreadsheet-based tool that compares anticipated v/c of various intersection types. This analysis determines the intersection type that will provide the most capacity given a set of simple traffic flow estimates. CAP-X analyzes multiple intersection types, but there are a few exceptions, such as TWSC and AWSC. An analysis in CAP-X can be completed for a large or small network. CAP-X does not account for varying costs of intersection implementation, nor an intersection’s impact on safety. The CAP-X inputs include:
- turning movement volumes (veh/hr);
- percent heavy vehicles;
- historical growth rate;
- lane assignments for each control type; and
- pre-selection of practical alternatives to be analyzed (Step 2B)
Optional CAP-X inputs include:
- Volume adjustment factor;
- Passenger car equivalent (PCE) factor;
- Critical lane volume sum limits;
- Heavy vehicle percentages; and
- Multimodal bicycle and pedestrian accessibility needs by the number of crossings for each intersection type being evaluated
10.3.2.1 Traffic Control Warrants
It is recommended that two-way stop control warrants, all-way stop control warrants, and traffic signal warrants be checked (if applicable) per the TMUTCD
(Appendix K, Section 8 – External References (Reference 7))
prior to intersection analysis. The investigation will help determine whether the intersection control type is warranted and if further analysis is necessary.10.3.2.2 TWSC Warrants
Two-way Stop-control warrants are typically checked per TMUTCD. According to the TMUTCD, the use of STOP signs on the minor-street approaches can be considered if engineering judgement indicates that a stop is always necessary because of one or more of the following conditions:
- The vehicular traffic volumes on the through street or highway exceed 6,000 vehicles per day;
- A restricted view exists that necessitates road users to stop to adequately observe conflicting traffic on the through street or highway; and/or
- Crash records indicate that three or more crashes that are susceptible to correction by the installation of a STOP sign have been reported within a 12-month period, or that five or more such crashes have been reported within a two-year period. Such crashes include right-angle collisions involving road users on the minor-street approach failing to yield the ROW to traffic on the through street or highway.
For more information regarding TWSC warrants, see Section 2B.06 in the TMUTCD.
10.3.2.3 AWSC Warrants
AWSC control warrants are typically checked per the TMUTCD. According to the TMUTCD, AWSC may be a useful safety measure at intersections if certain traffic conditions exist. Safety issues associated with AWSC include pedestrians, bicyclists, and all road users expecting other road users to stop. AWSC is used where the volume of traffic on the intersecting roads is approximately equal.
- The decision to install an AWSC is based on an engineering study.
- The following criteria is typically considered in the engineering study for an AWSC sign installation:
- Where traffic signal controls are justified, the AWSC is an interim measure that can be installed quickly to control traffic while arrangements are made for the installation of the traffic control signal.
- Five or more reported crashes in a 12-month period that are susceptible to correction by an AWSC sign installation. Such crashes include right-turn and left-turn collisions as well as right-angle collisions.
- Minimum volumes:
- The vehicular volume entering the intersection from the major street approaches (total of both approaches) averages at least 300 vehicles per hour for any eight hours of an average day; and
- The combined vehicular, pedestrian, and bicycle volume entering the intersection from the minor street approaches (total of both approaches) averages at least 200 vehicles per hour for the same eight hours, with an average delay to minor-street vehicular traffic of at least 30 seconds per vehicle during the highest hour; but
- If the 85th percentile approach speed of the major-street traffic exceeds 40 mph, the minimum vehicular volume warrants are 70 percent of the values provided in Items 1 and 2.
- Where no single criterion is satisfied, but where crash criteria and minimum volume criteria 1 and 2 are all met. Minimum volume criteria 3 is excluded from this condition.
For more information regarding AWSC warrants, refer to Section 2B.07 in the TMUTCD.
10.3.2.4 Signalized Intersection Warrants
Signal intersection warrants are checked per the TMUTCD. Typically, a signal warrant analysis comes after the determination that a signalized intersection is a viable alternative.
According to the TMUTCD, a signal warrant analysis is comprised of nine warrants, all of which are considered as part of the analysis. The warrants are:
- Warrant 1, Eight-Hour Vehicular Volume;
- Warrant 2, Four-Hour Vehicular Volume;
- Warrant 3, Peak Hour;
- Warrant 4, Pedestrian Volume;
- Warrant 5, School Crossing;
- Warrant 6, Coordinated Signal System;
- Warrant 7, Crash Experience;
- Warrant 8, Roadway Network; and
- Warrant 9, Intersection Near a Grade Crossing
For detailed information about conducting a signal warrant analysis, see
Appendix K, Section 5 - TMUTCD Signal Warrant Analysis Guidelines
. Additionally, a signal warrant analysis workbook is provided in Appendix K, Section 6 - TMUTCD Signal Warrant Analysis Spreadsheet
.10.3.3 Stage 1 Safety Performance and ICE
The SPICE Tool is intended to aid in the determination of a preferred alternative for a given intersection project by providing an objective, quantifiable basis to compare the safety performance of different intersection types.
Appendix K, Section 8
provides a link to acquire the SPICE spreadsheet tool. The SPICE Tool uses the SPF’s in Part C of the HSM (and subsequent NCHRP Reports) to select high-quality CMF’s from Part D of the HSM and the FHWA/University of North Carolina CMF Clearinghouse crash database, to predict crash frequency and severity for a variety of intersection control strategies. Based on the input parameters, the tool specifies the predicted crash frequency and crash severity for each control strategy selected for evaluation. Practitioners can conduct analysis for the opening year, Design Year, or over the lifecycle of the improvement. Inputs include pre-selection of practical control strategies, AADT information, pedestrian volume and site context information, e.g., schools within 100ft of the intersection., the number of turn lanes. The tool generates crash predictions that are used to rank the most and least safest control strategies. Those results are compared and combined with the CAP-X results to short-list intersection control alternatives to be studied in Stage 2 detailed evaluation.10.3.4 Stage 2 Operational Performance and ICE
The main tools used in Stage 2 ICE are Synchro, HCS, and Vissim. The analysis software tool selection is based on intersection type, project complexity, and level of detail (see ). Information related to the capabilities of the software is found in
Chapter 4 and Chapter 12, Appendix M
. When performing Stage 2 operational analysis, expanding the study area to include more than the project intersection is recommended if:
- The study intersection or adjacent intersections will be impacted by queue spillback.
- The study intersection operates within a coordinated system due to signalization.
- The study intersection has geometric conditions in the vicinity, such as a nearby U-turn intersection.
See
Chapter 2
for data collection resources. provides needed and optional data inputs for the various tools in the two stages of ICE. For optional data inputs, default values are often used. Changing default values of optional data inputs is not critical to the analysis output but changing default values of needed data inputs is critical for operational analysis.
10.3.4.1 Service Volumes
FHWA has created “rule-of-thumb” intersection capacities that are used to determine if left-turn lane configuration at a signalized intersection is sufficient. See for thresholds based on various left-turn treatment scenarios.
Intersection Type | Level of Detail | ||
|---|---|---|---|
Sketch Level or Macroscopic | HCM Based (Mesoscopic) | Microsimulation (Microscopic) | |
Two-Way Stop Control (TWSC) | Not applicable | Synchro, HCS | Vissim, CORSIM |
All-Way Stop Control (AWSC) | Not applicable | Synchro, HCS | Vissim, CORSIM |
Traffic Signal | CAP-X | Synchro, HCS | Vissim, CORSIM |
Roundabout | See Chapter 12, Appendix M | See Chapter 12, Appendix M | See Chapter 12, Appendix M |
Alternative Intersection (DLT, RCUT, MUT, CGT, gradeseparated) | CAP-X 1 (Synchro for CGT or grade separated) | Synchro, HCS2 | Vissim, CORSIM |
1
Synchro can be used for CGT and grade-separated intersections 2
Vissim can be used for HCM-based (mesoscopic) analysis when the facility type is unavailable in HCSTool | Necessary Data Inputs | Optional Data Inputs |
Synchro |
|
|
HCS |
|
|
Vissim |
|
|
CORSIM |
|
|
Case I: No Exclusive Left-Turn Lanes | ||||
Assumed critical signal phases* | 2 | |||
Left-turn volumes | Critical major approach**: ≤ 125 veh/hr | |||
Critical minor approach: ≤ 100 veh/hr | ||||
Planning-level capacity (veh/hr), sum of critical approach volumes*** | Number of basic lanes,**** major approach | |||
2 | 3 | 4 | ||
Number of basic lanes, minor approach | 1 | 1,700 | 2,300 | - |
2 | 2,400 | 3,000 | - | |
3 | - | - | - | |
Case II: Exclusive Left-Turn Lane on Major Approaches Only | ||||
Assumed critical signal phases | 3 | |||
Left-turn volumes | Critical major approach: 150-350 veh/hr | |||
Critical minor approach: ≤ 125 veh/hr | ||||
Planning-level capacity (veh/hr), sum of critical approach volumes | Number of basic lanes, major approach | |||
2 | 3 | 4 | ||
Number of basic lanes, minor approach | 1 | 1,600 | 2,100 | 2,300 |
2 | 2,100 | 2,600 | 2,800 | |
3 | 2,700 | 3,000 | 3,200 | |
Case III: Exclusive Left-Turn Lane on Both Major and Minor Approaches | ||||
Assumed critical signal phases | 3 | |||
Left-turn volumes | Critical major approach: 150-350 veh/hr | |||
Critical minor approach: ≤ 125 veh/hr | ||||
Planning-level capacity (veh/hr), sum of critical approach volumes | Number of basic lanes, major approach | |||
2 | 3 | 4 | ||
Number of basic lanes, minor approach | 1 | 1,500 | 1,800 | 2,000 |
2 | 1,900 | 2,100 | 2,400 | |
3 | 2,200 | 2,300 | 2,800 | |
Notes:
* Critical signal phases are nonconcurrent phases
**A critical approach is the higher of two opposing approaches (assumes same number of lanes)
***Use fraction of capacity for design purposes (e.g., 85 or 90 percent)
****Basic lanes are through lanes, exclusive of turning lanes
Adapted from NCHRP 279, figure 4-11
10.3.4.2 HCM-based
Synchro and HCS are recommended to be used when a more detailed analysis is necessary. HCM-based tools call for more inputs than CAP-X and sketch-level roundabout analysis and results could account for variables not considered with ICE Stage 1. For information on conducting an intersection analysis using HCM-based tools, refer to software user guides.
10.3.4.3 Microsimulation
Microsimulation may be used for intersection analysis where complex geometry exists, other tools cannot adequately model the intersection, and projects that call for high levels of detail. See
Chapter 13
for more information on conducting an analysis using microsimulation.10.3.4.4 Results and Measure of Effectiveness (MOEs)
Intersection analysis using HCM-based tools (i.e., Synchro and HCS) are evaluated in terms of LOS based on either control delay, LOS score (a measure used to rank pedestrian and bicycle facilities based on pedestrian perception and bicycle perception), or experienced travel time (ETT). shows the MOEs for each type of operational analysis tool. Enhanced operational performance equates to a low v/c ratio, low control delay, LOS A (optimal) to LOS D (acceptable), and short queue length.
The delay output by Vissim is calculated using a different method than in HCM based tools, so use caution when comparing the delays between Vissim results and HCM-based software. Relevant pairs of intersection chapters from the HCM 7th Edition are listed below:
- Signalized Intersections: Chapter 19 (methodology), Chapter 31 (applications);
- Two-way Stop-controlled Intersections: Chapter 20 (methodology), Chapter 32 (applications);
- AWSC: Chapter 21 (methodology), Chapter 32 (applications);
- Roundabouts: Chapter 22 (methodology), Chapter 33 (applications); and
- Alternative Intersections (Continuous Flow/Displaced Left-Turn, RCUT, MUT): Chapter 23 (methodology), Chapter 34 (applications)
shows HCM LOS criteria for signalized intersections. provides HCM LOS criteria for TWSC and AWSC intersections.
Tool | Outputs |
|---|---|
CAP-X | v/c ratios of top 10 selected intersection types |
Synchro | v/c ratio, control delay, LOS, 95% queue length |
HCS | v/c ratio, control delay, LOS, 95% queue length, |
Warrants (using Synchro, HCS, or other tools) | Warrant met or warrant not met |
Vissim | Average vehicle travel times (sec), average total delay per vehicle (sec), percent of queue length, ETT |
CORSIM | Control delay, queue length, travel speed, travel time, LOS |
Control Delay (s/veh) | LOS by Volume-to-Capacity Ratioa | |
|---|---|---|
v/c ≤ 1.0 | v/c >1.0 | |
≤ 10 | A | F |
> 10-20 | B | F |
> 20-35 | C | F |
> 35-55 | D | F |
> 55-80 | E | F |
>80 | F | F |
Note: For approach-based and intersection-wide assessments, LOS is defined solely by control delay.
Control Delay (s/veh) | LOS by Volume-to-Capacity Ratio | |
|---|---|---|
v/c ≤ 1.0 | v/c >1.0 | |
≤ 10 | A | F |
> 10-15 | B | F |
> 15-25 | C | F |
> 25-35 | D | F |
> 35-50 | E | F |
>50 | F | F |
Note: The LOS criteria apply to each lane on a given approach and to each approach on the minor street. LOS is not calculated for major-street approaches or for the intersection.
10.3.5 Stage 2 Safety Performance and ICE
A Stage 2 safety analysis is completed when more analysis is beneficial beyond Stage 1 and/or when detailed safety analysis is needed for cost-benefit analysis. This section covers the primary safety analysis tools (historical crash analysis, collision diagram, crash rates, HSM Safety SPFs, and CMFs, and SPICE and the SSI Tool that are typically used to evaluate different intersection control options for vehicles, pedestrians, and bicyclists.
Chapter 5
and Chapter 6
cover additional information and guidance on conducting a safety analysis. It is recommended that safety countermeasures are incorporated as part of the project, based on crash analysis. A typical safety analysis of an existing intersection includes performing a historical crash analysis, creating a collision diagram, and calculating the crash rate. An historical crash analysis is typically completed to identify the types of crashes occurring at the intersection. FHWA recommends collecting a minimum of three to five years of crash data due to the variability of crash frequencies each year. At a minimum, collect the number of crashes, crash type (rearend, sideswipe, etc.), crash severity, and contributing factors. See
Chapter 2
for data collection resourcesA typical safety analysis of a future intersection includes performing a predictive crash analysis. lists the data inputs for the historical and predictive safety analysis tools. Following development of future crash predictions for a proposed intersection conversion, the Stage 2 safety analysis determines the expected crash reduction of converting and intersection. Each eligible proposed highway safety project is subjected to a B/C analysis. For this purpose, TxDOT has developed the SII tool.
Another tool that is used for post-ICE analysis is the Intersection SST, adopted by the Texas Transportation Commission in 2019. It is applied
at the end of the ICE process
, when a preferred intersection type is confirmed. The SST is used to optimize the preferred type of control through an exploration of design elements that affect safety. The basic approach to safety scoring assigns design elements to categories then defines standard and optimal values for each element in categories of geometric, traffic and roadside. The score of a combination of optimal elements helps to identify an optimal design overall. Its purpose is to increase awareness of how design changes can affect safety.Tool | Inputs | Outputs |
|---|---|---|
Historical Crash Analysis and Collision Diagram | Intersection crash frequency, description, severity, and type over a period of 3-5 years | Identification of patterns by class, type and spatial locations |
Crash Rate | Intersection crash frequency over three to five years, turning movement volumes, or AADTs per approach | Comparison of project crash rates with the state-wide critical rates |
HSM and current SPFs and CMFs | Turning movement volumes, AADT, speed limit, pedestrian volumes per day, and maximum number of lanes crossed by a pedestrian | Crash frequency of converted intersection derived from SPF’s or CMF’s |
SPICE – Stage 1 ICE Process | AADT for major and minor road, number of turn lanes, modifications to HSM Part C CMF, and SPF calibration default values (optional) | Validation of safety benefits of various intersection types Ranking of intersection type by safety benefit |
Safety Improvement Index (SII) – Stage 2 ICE Process |
|
|
TxDOT’s Intersection Safety Scoring Tool (Appendix G, Section 4 – External References (Reference 7)) | AADT for major and minor road, number of through lanes, speed limit, existing sight distance, pedestrian and bicycle flow; annual crash frequencies (veh., ped and bike) | At the end of Stage 2 ICE, ranking of the preferred intersection improvement according to specific design elements included or added to each alternative intersection by safety benefit |
10.3.5.1 Historical Crash Analysis Intersection Crash Rate
Intersection crash rate is a diagnostic tool rather than a predictive tool. It is calculated from historical data to determine the safety level at an existing intersection. Crash rates calculate the number of crashes for a given period and location over a measure of exposure in terms of traffic volume. They help account for low volume intersections with a seemingly low number of crashes that are experiencing a high crash exposure. Crash rates are used to prioritize intersection improvement projects identified through network screening, when resources and funds are limited. The intersection crash rate equation is:
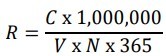
Where:
R = Crash rate for the intersection expressed as crashed per 1 MEV
C = Total number of intersection crashes in the study period (typically three to five years of data)
V = Traffic volume entering the intersection daily (obtained from traffic management center data or AADTs) per approach
N = Number of years in the study period
10.3.5.2 Collision Diagram
Once the crash frequencies, types, and severities are identified, conduct a crash pattern analysis using a collision diagram. Collision diagrams visually display locations and types of crashes by direction of travel to facilitate identification of patterns and clusters. Recognizing over-represented or target crash patterns helps identify which control type countermeasures can help prevent those crash patterns from reoccurring. For example, installing a traffic signal could help reduce the number of right-angle crashes. See for an example of an injury collision diagram. See
Appendix K, Section 9 – Crash Diagram Template
for a template of a crash diagram.10.3.5.3 Predictive Safety Analysis
AAHSTO’s HSM Part C uses SPFs to predict average crash frequency of three-leg and four-leg signalized and TWSC intersections. The HSM uses CMFs in Part C to compute the change in expected average crash frequency. CMFs less than one indicate a decrease in crash rates. HSM Part D includes additional CMF at stop-controlled, signalized, and roundabout intersections but is focused on conventional four-leg and three leg intersection types. CMFs cover the following intersection applications:
- Converting a four-leg TWSC to two three-leg intersections;
- Converting a signalized intersection to a single lane or multilane roundabout;
- Converting a TWSC or AWSC intersection into a single lane or multilane roundabout;
- Converting a TWSC to AWSC (assuming TMUTCD warrants are met); and
- Converting a TWSC to signal control (assuming TMUTCD warrants are met)
The HSM also provides CMFs related to geometric design changes, such as adding left-turn lanes to approaches on TWSC, AWSC, and signalized intersections. CMFs are not provided but crash trends are provided in the HSM for multimodal design changes, such as providing bicycle lanes, raised crosswalks, raised bicycle crossings, marked crosswalks, and refuge islands. Regarding alternative intersections, the HSM covers CMFs associated with replacing direct left-turns with right-turn/U-turn maneuvers at unsignalized intersections.
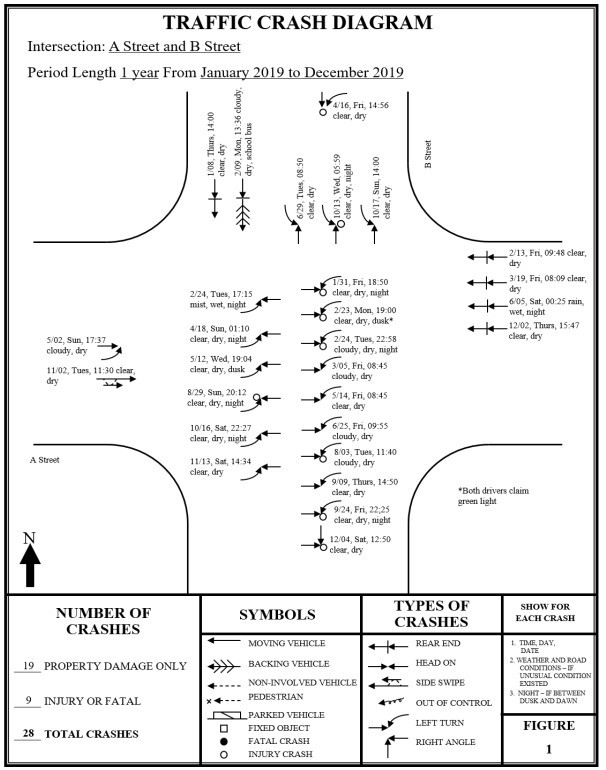
Figure 10-11: Injury Collision Diagram
10.3.5.4 Pedestrian and Bicycle Considerations
As of 2024, pedestrian and bicycle LOS for interchanges is not included in the HCM 7th Edition. Pedestrian control delay can be evaluated at individual signalized intersections, and pedestrian crossing delay can be evaluated at unsignalized intersections. The quality of service of pedestrian and bicyclists along the arterial of an interchange can be approximated using HCM’s Urban Street Facilities methodologies. CAP-X evaluates the level of pedestrian and bicycle accommodations at intersection and interchange types. Inputs include number of pedestrian crossings, number of lanes, and vehicle speeds at each crossing. CPA-X also provides a similar assessment of bicycle accommodations to compare alternative intersections for bicycle friendliness. The suitability of each intersection alternative for pedestrians and bicyclists is assessed with an emphasis on convenience and accessibility.
NCHRP 948: Guide for Pedestrian and Bicyclist Safety at Alternative and Other Intersections and Interchanges provides additional guidance on accommodating pedestrians and bicyclists at diverging diamond interchanges (DDI). See
Chapter 14
for more information on multimodal accommodations and analyses.10.3.6 Cost-Benefit Analysis
A cost-benefit analysis should be done for each alternative to gain a complete picture of benefits and cost, particularly to achieve maximum crash reduction benefits. For this purpose, the SII spreadsheet can be used. In its most basic form, the SII is the ratio of the annual savings in preventable crash costs that have occurred at a location to the cost of constructing the proposed improvement. Costs include cost of constructing or implementing improvements and cost of maintenance. Benefits are calculated in crash reduction savings, to weigh each cost in relation to its importance to the overall project purpose when comparing alternatives. A cost-benefit analysis consists of three parts:
- Opinion of Probable Construction Cost (OPCC)
- Estimate overall construction cost for the improvements.
- Review similar completed projects for an approximation.
- Include costs for ROW acquisition, utility relocations, and environmental impacts due to construction.
- Life Cycle Cost
- Compares intersection control costs including construction, maintenance, and operational costs.
- NCHRP’s Life-Cycle Cost Estimation Tool:
- For cost parameters, use TxDOT’s Road User Costs and NSC’s PCE average economic costs per injury severity.
- Safety Improvement Index (SII)
- TxDOT’s SII Calculator
- Refer to TxDOT’s HSIP Guidelines for CRF, service life, and preventable crash information for countermeasures permitted in the HSIP. Internal TxDOT personnel use the MicroStrategy SII reports, and external partners use the SII calculator worksheet.
10.3.7 Other Considerations (Impacts)
An alternative may address the intersection needs from an operational and safety perspective, but several other considerations may determine whether it is a practical option to pursue. These include the following:
- ROW, environmental impacts, and construction costs;
- Constructability timelines, staging, temporary traffic control needs, and project delivery;
- Acceptability of the alternative by the public, local jurisdictions, and other stakeholders; and
- Consistency within interregional corridors or other highways where a corridor study has been prepared.
Additionally, the multimodal assessment considers the suitability of each alternative for transit, freight, and other large vehicle operations when applicable. The Stage I scoping analysis with respect to freight and other large vehicle operation can be informed by whether an intersection is part of a designated Truck Route or Over-Size-Over-Weight Route. Transit assessments can be informed by discussions with the transit provider about different treatment options and any operating restrictions associated with different intersection and control types.