10.3.5 Stage 2 Safety Performance and ICE
A Stage 2 safety analysis is completed when more analysis is beneficial beyond Stage 1 and/or when detailed safety analysis is needed for cost-benefit analysis. This section covers the primary safety analysis tools (historical crash analysis, collision diagram, crash rates, HSM Safety SPFs, and CMFs, and SPICE and the SSI Tool that are typically used to evaluate different intersection control options for vehicles, pedestrians, and bicyclists.
Chapter 5
and Chapter 6
cover additional information and guidance on conducting a safety analysis. It is recommended that safety countermeasures are incorporated as part of the project, based on crash analysis. A typical safety analysis of an existing intersection includes performing a historical crash analysis, creating a collision diagram, and calculating the crash rate. An historical crash analysis is typically completed to identify the types of crashes occurring at the intersection. FHWA recommends collecting a minimum of three to five years of crash data due to the variability of crash frequencies each year. At a minimum, collect the number of crashes, crash type (rearend, sideswipe, etc.), crash severity, and contributing factors. See
Chapter 2
for data collection resourcesA typical safety analysis of a future intersection includes performing a predictive crash analysis. lists the data inputs for the historical and predictive safety analysis tools. Following development of future crash predictions for a proposed intersection conversion, the Stage 2 safety analysis determines the expected crash reduction of converting and intersection. Each eligible proposed highway safety project is subjected to a B/C analysis. For this purpose, TxDOT has developed the SII tool.
Another tool that is used for post-ICE analysis is the Intersection SST, adopted by the Texas Transportation Commission in 2019. It is applied
at the end of the ICE process
, when a preferred intersection type is confirmed. The SST is used to optimize the preferred type of control through an exploration of design elements that affect safety. The basic approach to safety scoring assigns design elements to categories then defines standard and optimal values for each element in categories of geometric, traffic and roadside. The score of a combination of optimal elements helps to identify an optimal design overall. Its purpose is to increase awareness of how design changes can affect safety.Tool | Inputs | Outputs |
|---|---|---|
Historical Crash Analysis and Collision Diagram | Intersection crash frequency, description, severity, and type over a period of 3-5 years | Identification of patterns by class, type and spatial locations |
Crash Rate | Intersection crash frequency over three to five years, turning movement volumes, or AADTs per approach | Comparison of project crash rates with the state-wide critical rates |
HSM and current SPFs and CMFs | Turning movement volumes, AADT, speed limit, pedestrian volumes per day, and maximum number of lanes crossed by a pedestrian | Crash frequency of converted intersection derived from SPF’s or CMF’s |
SPICE – Stage 1 ICE Process | AADT for major and minor road, number of turn lanes, modifications to HSM Part C CMF, and SPF calibration default values (optional) | Validation of safety benefits of various intersection types Ranking of intersection type by safety benefit |
Safety Improvement Index (SII) – Stage 2 ICE Process |
|
|
TxDOT’s Intersection Safety Scoring Tool (Appendix G, Section 4 – External References (Reference 7)) | AADT for major and minor road, number of through lanes, speed limit, existing sight distance, pedestrian and bicycle flow; annual crash frequencies (veh., ped and bike) | At the end of Stage 2 ICE, ranking of the preferred intersection improvement according to specific design elements included or added to each alternative intersection by safety benefit |
10.3.5.1 Historical Crash Analysis Intersection Crash Rate
Intersection crash rate is a diagnostic tool rather than a predictive tool. It is calculated from historical data to determine the safety level at an existing intersection. Crash rates calculate the number of crashes for a given period and location over a measure of exposure in terms of traffic volume. They help account for low volume intersections with a seemingly low number of crashes that are experiencing a high crash exposure. Crash rates are used to prioritize intersection improvement projects identified through network screening, when resources and funds are limited. The intersection crash rate equation is:
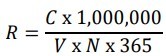
Where:
R = Crash rate for the intersection expressed as crashed per 1 MEV
C = Total number of intersection crashes in the study period (typically three to five years of data)
V = Traffic volume entering the intersection daily (obtained from traffic management center data or AADTs) per approach
N = Number of years in the study period
10.3.5.2 Collision Diagram
Once the crash frequencies, types, and severities are identified, conduct a crash pattern analysis using a collision diagram. Collision diagrams visually display locations and types of crashes by direction of travel to facilitate identification of patterns and clusters. Recognizing over-represented or target crash patterns helps identify which control type countermeasures can help prevent those crash patterns from reoccurring. For example, installing a traffic signal could help reduce the number of right-angle crashes. See for an example of an injury collision diagram. See
Appendix K, Section 9 – Crash Diagram Template
for a template of a crash diagram.10.3.5.3 Predictive Safety Analysis
AAHSTO’s HSM Part C uses SPFs to predict average crash frequency of three-leg and four-leg signalized and TWSC intersections. The HSM uses CMFs in Part C to compute the change in expected average crash frequency. CMFs less than one indicate a decrease in crash rates. HSM Part D includes additional CMF at stop-controlled, signalized, and roundabout intersections but is focused on conventional four-leg and three leg intersection types. CMFs cover the following intersection applications:
- Converting a four-leg TWSC to two three-leg intersections;
- Converting a signalized intersection to a single lane or multilane roundabout;
- Converting a TWSC or AWSC intersection into a single lane or multilane roundabout;
- Converting a TWSC to AWSC (assuming TMUTCD warrants are met); and
- Converting a TWSC to signal control (assuming TMUTCD warrants are met)
The HSM also provides CMFs related to geometric design changes, such as adding left-turn lanes to approaches on TWSC, AWSC, and signalized intersections. CMFs are not provided but crash trends are provided in the HSM for multimodal design changes, such as providing bicycle lanes, raised crosswalks, raised bicycle crossings, marked crosswalks, and refuge islands. Regarding alternative intersections, the HSM covers CMFs associated with replacing direct left-turns with right-turn/U-turn maneuvers at unsignalized intersections.
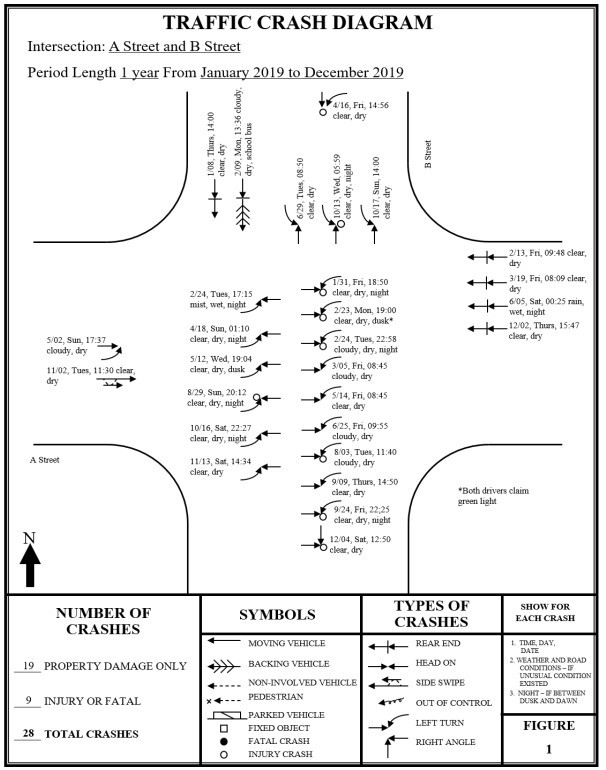
Figure 10-11: Injury Collision Diagram
10.3.5.4 Pedestrian and Bicycle Considerations
As of 2024, pedestrian and bicycle LOS for interchanges is not included in the HCM 7th Edition. Pedestrian control delay can be evaluated at individual signalized intersections, and pedestrian crossing delay can be evaluated at unsignalized intersections. The quality of service of pedestrian and bicyclists along the arterial of an interchange can be approximated using HCM’s Urban Street Facilities methodologies. CAP-X evaluates the level of pedestrian and bicycle accommodations at intersection and interchange types. Inputs include number of pedestrian crossings, number of lanes, and vehicle speeds at each crossing. CPA-X also provides a similar assessment of bicycle accommodations to compare alternative intersections for bicycle friendliness. The suitability of each intersection alternative for pedestrians and bicyclists is assessed with an emphasis on convenience and accessibility.
NCHRP 948: Guide for Pedestrian and Bicyclist Safety at Alternative and Other Intersections and Interchanges provides additional guidance on accommodating pedestrians and bicyclists at diverging diamond interchanges (DDI). See
Chapter 14
for more information on multimodal accommodations and analyses.