4.3 Traffic Characteristics
Information on traffic characteristics is vital in selecting the appropriate geometric features of a roadway. Necessary traffic data includes:
- Traffic Volume;
- Design Vehicles; and
- Highway Capacity
4.3.1 Traffic Volume
Traffic volume is an important basis for determining what improvements, if any, are required on a highway or street facility. Traffic volumes may be expressed in terms of projected annual average daily traffic (AADT) for the design year, or design hourly volumes (DHV). These volumes may be used to calculate the service flow rate, which is typically used for evaluations of geometric design alternatives and safety analysis.
4.3.1.1 Annual Average Daily Traffic
AADT represents the total traffic for a year divided by 365, or the annual average traffic volume per day. Due to seasonal, weekly, daily, or hourly variations,
AADT by itself lacks the level of precision to adequately predict the anticipated vehicular operations. Design Hourly Volume (DHV) is the preferred method for determining the anticipated vehicular operations of the roadway.
4.3.1.2 Traffic Forecast
Historically, project-level traffic forecasts were developed and approved by TPP. However, at the time of the writing of this document, TPP is in the process of decentralizing these efforts.
Please consult the
for additional details.
There are generally three approaches to developing daily traffic forecasts:
- Metropolitan Planning Organization (MPO) Travel Demand Model:MPO’s travel demand model is used to estimate traffic on the project for opening and design year.
- Pivot/Trend Line/Growth Method:A growth rate is developed using the historical average annual daily traffic data for 20 years and projected for the next 20 years (pivot year). Growth factors are used to convert existing year traffic to opening year traffic and opening year traffic to design year traffic.
- Hybrid Approach:This approach uses a combination of the first and second methods. MPO’s travel demand model is used for developing traffic projections and adjustments are made using growth factors developed by historical or trend line analysis.
Guidance on each of these methods or a combination of the methods at the project level for traffic forecasts can be found in the
.
4.3.1.3 Design Hourly Volume
The peak DHV is usually the 30
th
highest hourly volume for the design year, which is commonly 20 years from the time of expected construction completion. For situations involving high seasonal fluctuations in AADT, some adjustment of DHV may be appropriate.4.3.1.4 Computation of DHV and DDHV
For one-way facilities, the AADT is the total traffic volume. For two-lane, two-way, rural highways without major intersections (i.e., intersections where two arterial roads cross) or where additional lanes are not anticipated for the foreseeable future, the volumes are relatively balanced in both directions. Therefore, the AADT
NDIR
is the total traffic in both directions of travel (i.e., non-directional).The percent of AADT occurring in the design hour (K) may be used to convert non-directional AADT to DHV as follows:
DHV = (AADT
NDIR
)(K)For urban and metropolitan areas, traffic volumes often show significantly different directional distribution, especially at the interchanges/intersections during AM and PM peak durations. In some cases, significant traffic occurs during mid-day and weekends. Traffic volumes for peak hour or peak period are vital in developing existing and future design transportation needs. Review of 24-hour traffic volume profiles at key locations will determine the peak hour/period. Estimating future traffic volumes in AM and PM peak periods can be a complex process. Refer to
and the
for additional information and guidance.
On two-way facilities with more than two lanes (or on two-lane, two-way facilities where major intersections are encountered or where additional lanes are to be provided later), knowledge of the directional distribution of traffic during the design hour, Directional Design Hourly Volume (DDHV), is essential for design. DHV and DDHV may be determined by the application of conversion factors to AADT.
The percentage of AADT occurring in the design hour (K) and the design volume that is in the predominant direction of travel (D) are both considered, and doubled, in converting directional AADT to DHV as follows:
DHV = (AADT) (K) (D) (2)
The K-factor and the percent of directional distribution (D) are both considered in converting non-directional AADT to DDHV, as follows:
DDHV = (AADT
NDIR
) (K) (D) 4.3.1.5 Directional Distribution (D)
Traffic tends to be more equally divided by direction near the center of an urban area or on loop facilities. For other facilities, the directional distribution is frequently close to 60 to 70 percent.
4.3.1.6 K Factor (K)
K is the percentage of AADT representing the 30
th
highest hourly volume in the design year. For typical main rural highways, K-factors generally range from 12 to 18 percent. For urban facilities, K-factors are typically lower, ranging from 8 to 12 percent.4.3.1.7 Service Flow Rate (SF)
A facility should be designed to provide sufficient capacity to accommodate the design traffic volumes (AADT, DHV, DDHV). The necessary capacity of a roadway is initially based on a set of “ideal conditions.” These conditions are then adjusted for the “actual conditions” that are predicted to exist on the roadway section. This adjusted capacity is referred to as the service flow rate (SF) and is defined as a measure of the maximum flow rate under prevailing conditions.
Adjusting for prevailing conditions involves adjusting for variations in the following factors:
- Lane width;
- Lateral clearances;
- Free-flow speed;
- Terrain; and
- Distribution of vehicle type.
Service flow rate is the traffic parameter most commonly used in capacity and LOS evaluations. Knowledge of highway capacity and LOS is essential to properly fit a planned highway or street to the requirements of traffic demand. Both capacity and LOS should be evaluated in the following analyses:
- Selecting geometric design for an intersection;
- Determining the appropriate type of facility and number of lanes warranted;
- Performing ramp merge/diverge analysis; and
- Performing weaving analysis and subsequent determination of weaving section lengths.
All roadway design should reflect proper consideration of capacity and LOS procedures as detailed in the HCM.
4.3.2 Design Vehicles
The key controls in geometric highway design are the physical characteristics and the proportions of vehicles of various sizes using the roadway. Therefore, it is appropriate to examine all vehicle types, establish general class groupings, and select vehicles of representative sizes within each class for design use. These selected vehicles, with representative weight, dimensions, and operating characteristics, are used to establish roadway design controls for accommodating designated vehicle classes and are known as design vehicles.
There are four general classes of design vehicles:
- Passenger Carsinclude cars of all sizes, sport/utility vehicles, minivans, vans, and pickup trucks;
- Busesinclude motor coaches, city transit, school, and articulated buses;
- Trucksinclude single unit trucks, truck tractor semitrailer combinations, and truck tractors with semitrailers in combination with full trailers; and
- Recreation Vehiclesinclude motor homes, cars with camper trailers, cars with boat trailers, and motor homes with pulling cars.
When designing the roadway facility, the designer should consider the largest design vehicle that is likely to use that facility with considerable frequency.
If a larger class of vehicle typically uses the facility, that vehicle shall govern the design, regardless of the minimum design vehicle required for the type of facility.
A large school bus (84 passengers) should be utilized for the design of intersections of highways with low-volume county roads and township/local roads under 400 AADT along with some subdivision street intersections.
The WB-67 truck should generally be the minimum size design vehicle considered for intersections of freeway ramp terminals with arterial crossroads and for other intersections on State highways and industrialized streets that carry high volumes of truck traffic.
For more guidance on design vehicles and representations of design vehicles turning movements refer to
and
.
depicts the minimum turning radii for design vehicles.
4.3.3 Control Vehicles
Geometric design may also incorporate a control vehicle. The control vehicle is an infrequent but necessary user of the facility and informs what operations need to be accommodated in the design of the facility. The control vehicle is generally larger than a design vehicle. As an example, a facility may be designed for WB-67’s but may also need to account for oversized tractor trailers carrying large materials such as wind turbines. Adopting both a design vehicle and a control vehicle encourages a safer design that can accommodate frequent and infrequent users. To prevent the overdesign of a facility, the control vehicle should only dictate how the design might accommodate a larger vehicle’s needs when using the facility.
Typically, a design vehicle can turn using one incoming and one receiving lane, while the control vehicle can turn using multiple lane spaces. Engineering judgement should be exercised when determining how many lane spaces a control vehicle can use.
shows an example of how the turning movements can differ between a design vehicle and control vehicle.
Design Vehicle Type | Passenger Car | Single-Unit Truck | Single-Unit Truck (Three Axle) | Intercity Bus (Motor Coach) | City Transit Bus | Conventional School Bus (65 pass.) | Large School Bus (84 pass.) 1 | Articulated Bus | Intermediate Semi-trailer | |
Symbol | P | SU-30 | SU-40 | BUS-40 | BUS-45 | CITY-BUS | S-BUS36 | S-BUS40 | A-BUS | WB-40 |
Minimum Design Turn Radius (ft) | 23.8 | 41.8 | 51.2 | 41.7 | 44.0 | 41.6 | 38.6 | 39.1 | 39.4 | 39.9 |
Centerline Turning Radius (CTR) (ft) 4 | 21.0 | 38.0 | 47.4 | 37.8 | 40.2 | 37.8 | 34.9 | 35.4 | 35.5 | 36.0 |
Minimum Inside Radius (ft) | 14.4 | 28.4 | 36.4 | 24.3 | 24.7 | 24.5 | 23.8 | 25.3 | 21.3 | 19.3 |
Design Vehicle Type | Interstate Semi Trailer | "Double Bottom" Combinati on | Rocky Mtn Double | Triple Semi-trailer/ Trailers | Turnpike Double Semi- trailer / Trailer | Motor Home | Car and Camper Trailer | Car and Boat Trailer | Motor Home and Boat Trailer | |
Symbol | WB-62 2 & WB-62TX | WB-67 3 | WB-67D | WB-92D | WB-100T | WB-109D 2 | MH | P/T | P/B | MH/B |
Minimum Design Turn Radius (ft) | 44.8 | 44.8 | 44.8 | 82.0 | 44.8 | 59.9 | 39.7 | 32.9 | 23.8 | 49.8 |
Centerline Turning Radius (CTR) (ft) 4 | 41.0 | 41.0 | 40.9 | 78.0 | 40.9 | 55.9 | 36.0 | 30.0 | 21.0 | 46.0 |
Minimum Inside Radius (ft) | 7.4 | 1.9 | 19.1 | 55.6 | 9.7 | 13.8 | 26.0 | 18.3 | 8.0 | 35 |
Notes: | ||||||||||
| ||||||||||
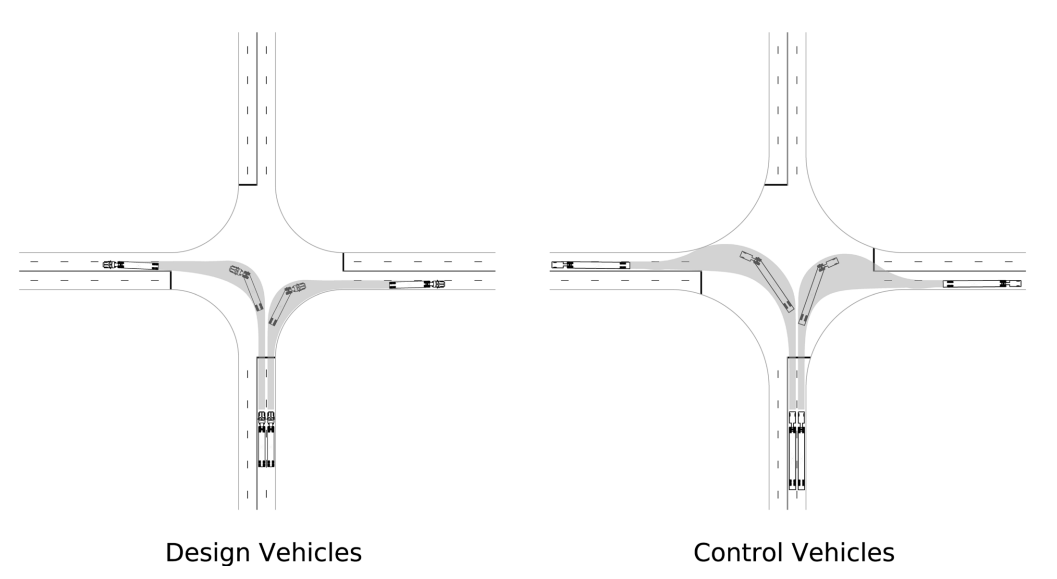
Figure 4-1: Lane usage for Design and Control Vehicle Turning Movements
4.3.4 Highway Capacity
Highway capacity is used to express the maximum hourly rate at which persons or vehicles can reasonably be expected to traverse a uniform section of a lane or roadway during a given period under roadway and traffic conditions. Highway capacity encompasses broader relations between highway characteristics and conditions, traffic composition and flow patterns, and the relative degree of congestion at various traffic volumes.
To determine the capacity for a particular roadway design, the designer should refer to the
for guidance. The
is used as the basic reference for performing operational analysis that may be appropriate depending on the circumstances and includes procedures for analyzing the LOS for all modes of travel.
Roadway capacity analysis serves three general purposes including:
- Transportation planning studies:used to assess the adequacy or sufficiency of existing roadway networks to service current traffic along with estimation of the future traffic growth that may exceed current capacity;
- Roadway design:used to select the roadway type and to determine dimensions such as the number and types of lanes and minimum lengths for weaving sections; and
- Traffic operational analyses:used to identify bottleneck locations of the roadway and to estimate operational improvements that may result from prospective traffic control measures or spot alterations in the roadway geometry.
While traffic volumes are the main contribution to the serviceability of a facility, roadway design features can also affect operating conditions. These roadway factors can be described as the following:
- Alignmentfor traffic traveling at any given speed, the better the roadway alignment the more traffic it can carry. It follows that congestions will generally be perceived at lower volumes if the design speed is low. The roadway should be subdivided into sections of consistent geometric design characteristics for analysis using the HCM techniques. A single limiting curve or steep grade in otherwise gentle alignment will be identified as the critical feature limiting roadway capacity.
- Weaving Sections:roadway segments where the pattern of traffic entering and leaving at contiguous points of access results in vehicle paths crossing each other. Where the distance in which the crossing is accomplished is relatively short in relation to the volume of weaving traffic, operations within the roadway section will be congested. Some reduction in operating efficiency through weaving sections can be tolerated by roadway users if the reduction is minor and the occurrence is not high.
- Ramp Terminals:these features can adversely influence operating conditions of freeways if the demand for their use is excessive or if their design is deficient. When congestion occurs at the freeway ramp junctions, typically drivers will avoid this lane and shift to the inside lanes causing congestion to the through lanes. The loss in efficiency is a function of the volume of traffic entering or leaving ramps, and the geometric layout of the terminals.
- Mixture of Vehicles:traffic streams are usually composed of a mixture of vehicles including passenger cars, trucks, buses, and occasionally recreational vehicles and bicycles. The combination of these vehicles creates a flow rate that is not uniform throughout the hour, day, season, or year.
- Peak Hour Factor:the factor used to convert the rate of flow during the highest 15-minute period to the total hourly volume is the peak hour factor (PHF). It is the ratio of the total hourly volume to the number of vehicles during the highest 15-minute period multiplied by 4.
4.3.4.1 Level of Service (LOS)
The HCM defines the quality of traffic service provided by specific roadway facilities under specific traffic demands by means of a LOS. The LOS characterizes the operating conditions on the facility in terms of traffic performance measures related to speed and travel time, freedom to maneuver, traffic interruptions, and comfort and convenience. The levels of service range from LOS A (least congested) to LOS F (most congested). The HCM procedures for estimating the traffic operation LOS should be used for all contexts. Designers should provide the highest LOS practical and consistent with the project functional and context classification.
discuss the target LOS based on functional class.
Level of Service | General Operating Conditions |
A | Free Flow |
B | Reasonably Free Flow |
C | Stable Flow |
D | Approaching Unstable Flow |
E | Unstable Flow |
F | Forced Breakdown Flow |