Section 3: Pump Station Hydrology
Methods for Design
In order to design a pump station effectively, the inflow hydrology must be known. The hydrology developed for the associated storm drain system usually will not serve as a firm basis for discharge determination into the pump station. A hydrograph is required because the time component is critical in understanding the inflow which governs the sizing of the wet well. The designer needs to know not only the peak inflow, but the timing and volume. The difference between the input and the output hydrographs is the storage requirement of the pump station wet well. The hydrograph should consider the storage abilities of the storm drain system, which may reduce the required size of the wet well. Governmental regulations or the physical limitations of the receiving waters determine the output discharge from the pump station.
The storm drain system associated with the pump station may have a design basis of less than 2% AEP. However, TxDOT recommends at least a 2% AEP flood design because the pump station is generally used when drainage by gravity from a low point is inadequate or impractical.
Procedure to Determine Mass Inflow
A mass inflow curve represents the cumulative inflow volume with respect to time. In order to determine a mass inflow curve, the hydraulic designer must first develop an inflow hydrograph based on a design storm. The most typical design method is the
, discussed in detail in Chapter 4. For the following procedure taken from FHWA Hydraulic Engineering Circular 24 (
) example, the hydrograph data in
of this manual will be used.
- Evaluate the time base of the hydrograph and select a time increment, usually the same time increment as that used for developing the inflow hydrograph.
- Develop a table with columns for time, time increment, inflow rate, average inflow rate, incremental inflow rate, cumulative inflow volume, cumulative outflow volume, and storage difference as shown in Table 11-1.
- At each time step, extract the inflow rate from the computed inflow hydrograph. (For this example, use , column Qu).
- Compute and tabulate the average inflow rate as half of the current and of the previous inflow rates for each time step. (i.e. time step 30: 188/2 cfs + 350/2 cfs = 269 cfs).
- Compute the incremental volume for each time step as the average inflow rate multiplied by the time step in seconds.
- Compute the cumulative inflow as the sum of each time step and the previous time step.
- Plot a curve of cumulative volume versus time. The result is a mass inflow curve, shown as .
- Determine the allowable discharge to the receiving waters. The pump flow rate must be at or below the allowable discharge rate. For this example, assume the allowable discharge rate is 100 cfs. Notice that the pumping did not start until a sufficient volume was in the wet well.
- Multiply the allowable discharge by the time step for the pump flow. Notice that the pumping cannot start until the inflow has developed. The greatest difference between inflow and pump flow is the required storage of the facility. The greatest difference in this example is at time step 80, which is about 691,200 cubic feet. The negative numbers at time steps 230 and 240 indicate that regular pumping should have stopped at about time step 220. The Pump Flow line is also plotted with the inflow curve in .
1 | 2 | 3 | 4 | 5 | 6 | 7 | 8 |
|---|---|---|---|---|---|---|---|
Time (minutes) | Time Increment (seconds) | Inflow Rate Q u (cfs) | Average Inflow (cfs) | Incremental Inflow (cubic feet) | Cumulative Inflow (cubic feet) | Cumulative Outflow (pump flow in cubic feet) | Storage Difference (cubic feet) |
0 | 0 | 0 | 0 | 0 | 0 | 0 | |
10 | 600 | 58 | 29.0 | 17,400 | 17,400 | 0 | 17,400 |
20 | 600 | 188 | 123.0 | 73,800 | 91,200 | 60,000 | 31,200 |
30 | 600 | 350 | 269.0 | 161,400 | 252,600 | 120,000 | 132,600 |
40 | 600 | 400 | 375.0 | 225,000 | 477,600 | 180,000 | 297,600 |
50 | 600 | 358 | 379.0 | 227,400 | 705,000 | 240,000 | 465,000 |
60 | 600 | 272 | 315.0 | 189,000 | 894,000 | 300,000 | 594,000 |
70 | 600 | 170 | 221.0 | 132,600 | 1,026,600 | 360,000 | 666,600 |
80 | 600 | 112 | 141.0 | 84,600 | 1,111,200 | 420,000 | 691,200 |
90 | 600 | 77 | 94.5 | 56,700 | 1,167,900 | 480,000 | 687,900 |
100 | 600 | 51 | 64.0 | 38,400 | 1,206,300 | 540,000 | 666,300 |
110 | 600 | 34 | 42.5 | 25,500 | 1,231,800 | 600,000 | 631,800 |
120 | 600 | 22 | 28.0 | 16,800 | 1,248,600 | 660,000 | 588,600 |
130 | 600 | 15 | 18.5 | 11,100 | 1,259,700 | 720,000 | 539,700 |
140 | 600 | 10 | 12.5 | 7,500 | 1,267,200 | 780,000 | 487,200 |
150 | 600 | 7 | 8.5 | 5,100 | 1,272,300 | 840,000 | 432,300 |
160 | 600 | 4 | 5.5 | 3,300 | 1,275,600 | 900,000 | 375,600 |
170 | 600 | 3 | 3.5 | 2,100 | 1,277,700 | 960,000 | 317,700 |
180 | 600 | 2 | 2.5 | 1,500 | 1,279,200 | 1,020,000 | 259,200 |
190 | 600 | 1 | 1.5 | 900 | 1,280,100 | 1,080,000 | 200,100 |
200 | 600 | 0 | 0.5 | 300 | 1,280,400 | 1,140,000 | 140,400 |
210 | 600 | 0 | 0.0 | 0 | 1,280,400 | 1,200,000 | 80,400 |
220 | 600 | 0 | 0.0 | 0 | 1,280,400 | 1,260,000 | 20,400 |
230 | 600 | 0 | 0.0 | 0 | 1,280,400 | 1,320,000 | -39,600 |
240 | 600 | 0 | 0.0 | 0 | 1,280,400 | 1,380,000 | -99,600 |
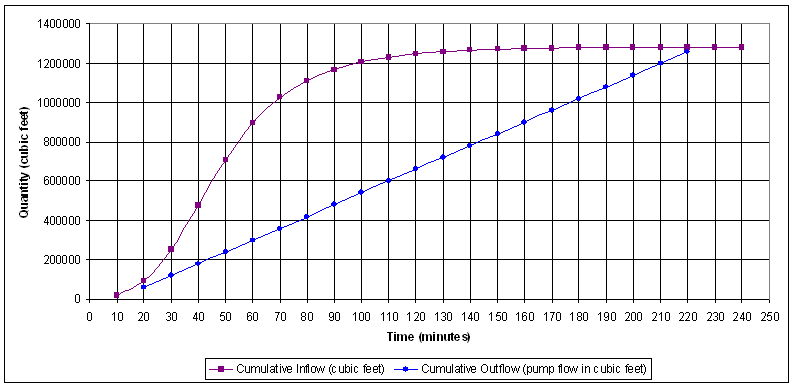
Figure 11-1. Inflow versus Pump Flow