8.2 Alternatives Analysis Elements
8.2.1 Analysis Tools and Methods
Typical analysis tools and methods for alternatives analysis include:
- Sketch-level or macroscopic tools: Used for high-level alternatives analysis for general order-of-magnitude estimates of travel demand and traffic operations. Examples are CAP-X and HCM service volume tables.
- TDM: Used for alternatives analysis to compare scenarios or screen alternatives at a high level.
- TDM outputs are typically used to determine the benefits and impacts of major highway improvements. Common outputs include origin and destination data, route choice, v/c, and vehicle miles traveled. Examples are TransCAD and Cube.
- Deterministic tools: Used in alternatives analysis to quickly determine the LOS (e.g., density, speed, and delay) of isolated or smaller-scale facilities. They are limited in their ability to analyze network or system effects. Examples are Synchro and Highway Capacity Software.
- Traffic signal optimization tools: Used to optimize signal timings for intersections, corridors, or networks. These tools can incorporate items such as intersection capacity, cycle lengths, splits, and signal coordination and offset. They are used to perform alternatives analysis for intersections or interchanges. Examples are Synchro and PASSER.
- Simulation tools: Used to simulate the traffic flows and movement of individual vehicles and pedestrians. These tools produce detailed outputs, need higher levels of effort, and can either be deterministic or stochastic in nature. They are best suited for alternatives analysis that involve oversaturated conditions, complex geometric configurations, and alternative intersections. Examples are Vissim, CORSIM, and DynusT.
- Safety analysis and tools: Safety analysis can be performed in terms of historical crash analysis or predictive safety analysis. Historical crashes (in terms of crash type, frequency and severity, contributing factors) are typically examined to select crash countermeasures in the alternatives analysis. Crash predictive methods can be used to estimate changes in the number of crashes associated with alternatives analysis. CMF are typically used as a multiplicative factor to estimate the expected number of crashes.
8.2.2 Define Evaluation Criteria
Selecting evaluation criteria demands engineering judgement and is typically coordinated with project stakeholders prior to proceeding with alternatives evaluation. Evaluation criteria are quantitative (MOEs) or qualitative indicators that enumerate impacts (good and bad) of an alternative. Traffic and Safety Analysis Procedures Manual | 2024 8-4 presents a flow diagram of potential evaluation criteria.
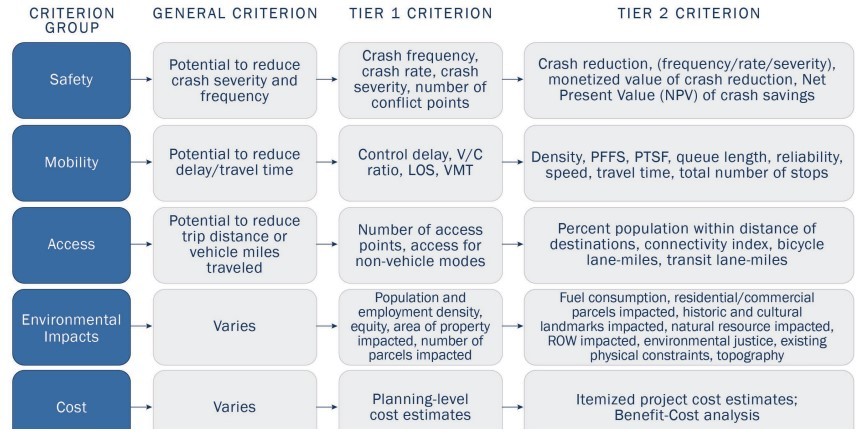
Figure 8-2: Evaluation Criteria
Criteria Definition Guidance:
- Objectivity:It is suggested that evaluation criteria aim to be objective and without bias.
- Criteria groups:Evaluation criteria that represent a range of project impacts and reflect all project goals/objectives selected. Common criteria groups include safety, mobility, access, environmental, and cost (see ).
- Quantitative criteria:Quantitative criteria are preferred and can include the MOEs discussed inChapter 4. Common quantitative criteria include crash rate, crash frequency, LOS, impacted residential parcels, and OD travel times.
- Qualitative criteria:For high-level evaluations where MOEs may not be feasible, qualitative criteria can be precisely defined and criterion scoring can be annotated. Examples of qualitative criteria are conflict points and driver expectancy. Conflict points help identify potential safety issues. Driver expectancy is another qualitative criterion that relates to a driver's readiness to respond accurately and promptly to situations, events, and information while driving.
- Quantitative comparison:Quantitative metrics can be reported for each alternative and then qualitatively “scored” to compare impacts between criteria.
- Trade-offs:A wide range of criteria can be employed to highlight benefits and costs of each alternative. This certifies trade-offs, or specific costs associated with selected benefits, are evaluated as part of the decision-making process.
- Weighting criteria:Trade-offs can be plainly demonstrated by weighting criteria; weights are assigned in proportion to the importance of each criterion. However, weighting criterion, as with assigning exact values to qualitative criterion, may misrepresent project impacts or over-complicate the alternatives analysis.
- Redundant criteria:It is recommended that redundant criteria (such as intersection LOS and control delay) be valued appropriately to avoid double-counting impacts.
- Multi-tier alternatives analysis:Evaluation criteria can differ between evaluation tiers (see ). For example, a Tier 0 (fatal-flaw) analysis can evaluate twelve Planning-level alternatives using sketch-level or macroscopic tools. A Tier 1 (preliminary) analysis can evaluate six Preliminary Schematics-level alternatives using HCM-based (mesoscopic) tools. A Tier 2 (detailed) analysis can evaluate three Advanced Schematics and Design-level alternatives using microsimulation (microscopic) tools.
Analysis Tier | Objective | Sample Criteria |
Tier 0 (Fatal Flaw) | Develop viable alternatives that satisfy the project’s purpose and need. Often evaluated using sketch-level or macroscopic tools based on a high-level sketch of the alternative. |
|
Tier 1 (Preliminary) | Refine viable alternatives for further evaluation. Often evaluated using a TDM output or HCM-based (mesoscopic) tools |
|
Tier 2 (Detailed) | Select the alternative that best satisfies the project’s purpose and need. Often evaluated using microsimulation (microscopic) or HCM -based (mesoscopic) tools. |
|
8.2.3 Alternative Development Guidance
- Number of alternatives:Varies by project scope and level of detail. A large number of alternatives are refined using a multi-tier screening process. Generally, three to five alternatives are evaluated in detail as the final analysis tier.
- Level of Analysis:Alternatives are developed with sufficient detail to adequately evaluate benefits and costs. Alternatives typically increase in detail (additional attributes characterizing each alternative) as the number of alternatives is reduced.
- Timeframe:Alternatives can be short-, mid-, or long-term. Short-term alternatives are often developed in more detail, while long-term alternatives have less detail (sketch-level).
- Type:Alternatives include infrastructure improvements, Transportation Demand Management improvements, and Transportation System Management (TSM) improvements (seeSection 15.2.2 and 15.5inChapter 15).
- Nomenclature:Name alternatives to be easily understood and distinguishable. Improvements for each alternative are directly stated.
- Description:Alternatives are often depicted graphically and described narratively, denoting key aspects (see ). If alternatives vary by specific elements (such as ROW, cross section, etc.), it is recommended they be represented in a matrix (see ).
No Build
Alternative 1 – Extend Widening to Third Street
Alternative 2 – One-Way Couplet
Alternative 3 – Two-Lane Elevated Bypass
|
Figure 8-3: Narrative Description of Alternatives Example
- No-Build Alternative:A no-build (base condition) alternative that represents future conditions without proposed project improvements is typically included as a benchmark for comparison. A no-build alternative typically considers existing conditions with committed projects. Any project expected to be complete prior to the analysis build year and included in a fiscally constrained funding program may be included in the no-build alternative. The no-build alternative serves as the baseline for analyzing other alternatives, so it is recommended that particular care be given when developing the no-build alternative.
- Traffic Projections:Baseline and future year traffic projections for the no-build scenario are typically used for each build scenario. However, it is recommended the build alternatives selected for evaluation be reviewed to determine whether new traffic projections are mandatory to represent the proposed improvements. This is common for access changes, new alignments, and locations where the existing corridor is capacity-constrained, resulting in detours. These detours are captured using the DTA routing methodology found in some microsimulation models. For regional and larger study areas, TDM outputs are often used to determine changes in travel patterns. For smaller corridor- or intersection-level studies, these changes can be assigned manually.
- Multi-tier alternatives analysis:Complex projects could necessitate alternatives to be developed and evaluated in sequence, with increasing levels of detail. Alternatives evaluated in subsequent tiers are typically based on evaluation results of prior tiers.
Nomenclature | Main Street Characteristics | Washington Avenue Characteristics | |||||
|---|---|---|---|---|---|---|---|
Alt. | Description | Lanes | Traffic Flow | Grade | Lanes | Traffic Flow | Grade |
No Build | Widening terminates at First Street | 4/6 | Bi-Directional | At-Grade | 2 | Bi-Directional | At-Grade |
1 | Extend Widening to Third Street | 6 | Bi-Directional | At-Grade | 2 | Bi-Directional | At-Grade |
2 | One-Way Couplet | 3 | Westbound | At-Grade | 3 | Eastbound | At-Grade |
3 | Two-Lane Elevated Bypass | 6 (2 by .) | Bi-Directional | At and Above | 2 | Bi-Directional | At-Grade |
8.2.4 Develop Alternatives
Prior to developing alternatives, the project team defines the scope and study area, determines the purpose and need, and sets project goals and objectives (see
Chapter 1
for guidance). Developing alternatives demands understanding the issues. Coordination with project stakeholders is necessary to establish that an appropriate range of alternatives is considered. The number of alternatives acknowledged varies by project scope and level of detail; three to five alternatives are generally evaluated at each “tier.” Potential solutions to be considered include:- Transportation System Management and Operations (TSMO) strategies;
- Transportation demand management improvements;
- Transportation system management improvements;
- Access control and local circulation changes;
- Multimodal and intermodal improvements;
- Safety solutions;
- Segment improvements;
- System improvements;
- Intersection improvements; and
- Interchanges
Consider developing alternatives with enough detail to adequately evaluate benefits and costs.
8.2.5 Evaluate Alternatives
After alternatives and evaluation criteria have been defined, each alternative is assessed based on selected criteria. For example, for the safety evaluation criteria, safety performance of the alternatives is evaluated. Design elements should be modified to optimize safety. Alternatives are analyzed using a welldefined, developed, calibrated, and validated baseline model.
Sensitivity analysis is used in the decisionmaking process for choosing among alternatives or for determining which alternatives maintain a certain level of mobility or safety. For example, sensitivity analysis could be performed by increasing traffic projections by 5 to 15 percent to determine how the study area would operate with increased traffic. Procedures for conducting traffic analyses are detailed in
Chapters 4, 9, 10, 11, 12, 13,
and 14
.Alternative Evaluation Guidance:
- Levels of Alternatives Analysis:Different levels of alternatives analysis are performed based on the scope, size, and complexity of the project. Network/corridor-level alternatives have a bigger scale and regional impact; these alternatives can use sketch-level or macroscopic tools or TDM outputs to assess alternatives. Intersection or interchange-level alternatives analysis are more localized and location-specific, so deterministic tools, traffic signal optimization tools, or simulation tools can be used to compare alternatives. Comparing alternatives includes comparing different build scenarios to the no-build scenario.
- Evaluation Results Narrative:It is recommended that evaluation results comprehensively describe the benefits and costs of each alternative. Evaluation results are typically described narratively and organized such that the preferred alternative is evident. Provide justification explaining how the preferred alternative meets project evaluation criteria and satisfies the project’s purpose and need.
- Discarded Alternatives:Evaluation results clarify why non-selected alternatives were discarded. Discarded alternatives are documented.
- Scoring:Generally, quantitative analysis results are converted to qualitative scores that are then compared to identify the preferred alternative.
Criterion Type | Criterion | Unit | Alternatives | |||
|---|---|---|---|---|---|---|
No Build | Extend Widening | Couplet | Bypass | |||
Safety | Predicted crash frequency | Crashes per Year | 60 | 60 | 50 | 40 |
NPV of crash savings | Dollars | $- | $- | $10,000,000 | $20,000,000 | |
Mobility | LOS - Intersection 1 | Grade | C | B | C | F |
Delay - Intersection 1 | sec/veh | 25 | 18 | 87 | 21 | |
LOS - Intersection 2 | Grade | B | B | D | C | |
Delay - Intersection 2 | sec/veh | 14 | 10 | 51 | 26 | |
Access | Bicycle lane-miles | Miles | - | 3 | 6 | - |
Transit lane-miles | Miles | - | 3 | 6 | 8 | |
Other | Proposed ROW Acquisition (Actual) | Square Feet | 105,037 | 105,037 | 91,016 | 121,489 |
*Residential Parcels Impacted | Number | 19 | 19 | 25 | 104 | |
*Commercial Parcels Impacted | Number | - | - | 1 | - | |
Cost | Dollars | $1,000,000 | $8,000,000 | $12,000,000 | $15,000,000 | |
*Impacted is defined as parcels with ROW is impacted by the alternative design
Criterion | Measures | Alternative with *Rating (1-5) | |||||||
|---|---|---|---|---|---|---|---|---|---|
No-Build | Extend Widening to Third Street | One-Way Couplet | Two-Lane Elevated Bypass | ||||||
Safety | Conflict points and driver expectancy | 2 | Merge, no access management | 4 | No merge, installed access manageme nt | 4 | Two-to-one-way conversion, introducing uncommon operation, fewer conflict points at intersections | 2 | High speeds, introducing uncommon operation |
Mobility | Travel speed, roadway capacity, and intersection capacity (Delay and LOS) | 1 | No increased capacity | 3 | Increased capacity | 4 | Increased capacity, fewer phases at traffic signals | 5 | Increased capacity |
Access | Property entry/exit points and local route distance | 4 | No access management | 3 | Restricted access (raised median) | 2 | Limits access, increases trip distance | 1 | Access controlled |
Property Impacts | Environmental and historic impacts | 5 | No ROW necessary | 3 | 50-foot ROW necessary | 5 | No ROW necessary | 1 | 100-foot ROW necessary |
ROW Cost | Cost of ROW expected to be purchased | 5 | No ROW necessary | 3 | 50-foot ROW necessary | 5 | No ROW necessary | 1 | 100-foot ROW necessary |
Construction Cost | Cost of materials to construct improvements | 5 | No improvement | 3 | Widening Main Street | 3 | Reconstructing Main Street, widening Washington Avenue | 1 | Elevated structure, widening Main Street |
Development Potential | Potential economic benefits | 2 | None | 3 | Increased volume | 5 | ROW made available for social/aesthetic improvements | 1 | None |
*Rating scale is from 1-5. 1 signifies the best rating and 5 signifies the worst rating
- B/C Analysis:Benefits and costs of each alternative are typically monetized so that alternatives can be compared economically. HSM procedures are typically used to monetize safety impacts. TxDOT’s Road User Cost (seeAppendix I, Section 2 – External References (Reference 2)) can be used to monetize vehicle operating impacts.