3.3 Forecasting Traffic Volumes
Forecasting traffic volumes involves growing existing volumes at a given growth rate to a future year. This section discusses forecasting traffic volumes with the latest TDM outputs, without the latest TDM outputs, and a hybrid of TDM outputs/no TDM outputs. For projects within the boundaries of an MPO, the latest MPO TDM outputs can be referenced to determine corridor growth rates for projects. For projects outside MPO boundaries, TPP’s SAM can be referenced to determine growth rates. For forecasting without TDM outputs, growth patterns and historical trends are used as a means of estimating future volumes. Traffic analyses for highway designs from adjacent projects are an additional resource for traffic projections. See for the typical traffic forecasting process. It is recommended that the traffic growth rates from the various data sources be documented and submitted as part of the Traffic Projections Methodology Memo. An
example
outline for Traffic Projections Methodology Memorandum is provided in Appendix D, Section 2 – Traffic Projections Methodology Memorandum Outline
. The growth rate for the first 20 years is typically higher than the growth rate for more than 20 years because the growth will taper down over time as the facility approaches capacity. For additional guidance on traffic volume and forecasting, refer to the TxDOT TPP Traffic Forecasting Analysis SOPs. Coordinate with the TxDOT project manager to gain access to the latest documents.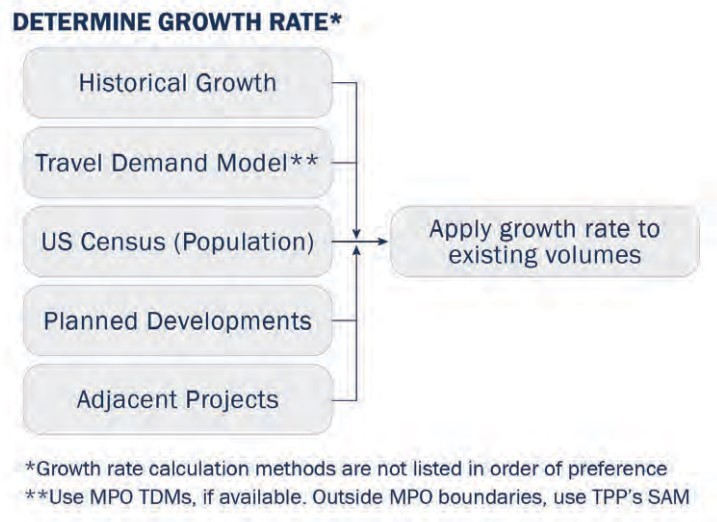
Figure 3-4: Traffic Forecasting Process
3.3.1 Traffic Volume Forecasting
TxDOT’s forecasting analysis process is currently classified into two different categories: TPP-led and District-led. The District provides TPP Traffic Analysis Branch a notification of the District Led Traffic Analysis. TPP maintains the statewide system of records for traffic forecasting. For additional guidance on traffic volume and forecasting, refer to the TxDOT TPP Traffic Forecasting Analysis SOPs. Coordinate with the TxDOT project manager to gain access to the latest documents.
3.3.2 Future Year Selection
Typical traffic forecasts include the project opening year, the design year (i.e., opening year + 20 years), and the pavement design year (i.e., opening year + 30 years). Traffic forecasts may also include an interim year. An interim year occurs between the opening year and pavement design year. Interim years may be used if the proposed improvements show failing Level of Service (LOS) prior to the design year. The opening year is the first year in which the proposed improvements are expected to be open to traffic. If the project is proposed to be implemented in phases, the opening year is the year the first phase will be opened to traffic. Opening year is typically determined by project size, complexity, and schedule, with respect to the letting date. The let date is dependent on the planning and programming of projects.
3.3.3 AM and PM Peak Hour Traffic Projections
The AM and PM peak hours are not always inversely related. Peak hour percentages in terms of the percentage of total daily traffic that is occurring in the AM/PM peak hour are determined separately for both the peak hours. The percentages are intended to be a representation of the existing traffic patterns. Typically, traffic counts are collected in the form of TMCs and segment counts. Assuming traffic counts are taken on a typical weekday with no major events or disruptions, they represent peak hour percentages for the AM and PM K-factors. The peak hour percentages are then applied to the ADTs to develop projected AM and PM peak hour volumes. It is recommended that the traffic counts collected be validated against STARS data, previous counts, or traffic forecasts.
Turning movement traffic projections are estimated by applying existing TMC percentages at each approach to the ADT volumes. TMCs are typically rounded to 50- vehicle increments. This avoids an overestimation of traffic on side streets. The traffic projections are then balanced along the corridor.
For an
example
on calculating AM and PM peak hour traffic projections, see Appendix D, Section 3 – Peak Hour Projection Calculations
.3.3.4 Traffic Balancing
See
Section 3.2.6
under Balancing for basic information on volume balancing. See for an example
of balanced traffic projections. For an example
calculation of volume balancing, see Appendix D, Section 5 – Balancing Traffic Volumes Example Calculations
.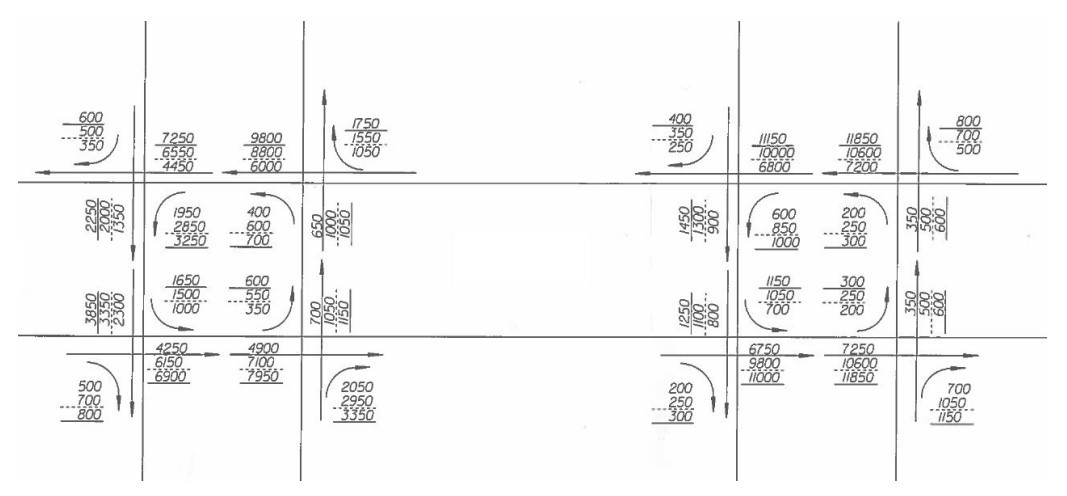
Figure 3-5: Example of a Balanced Network
3.3.5 Model Version Control
It is suggested that model versions used for nobuild and build analysis are captured in terms of corresponding filenames and folder names. Typically, each version or revision is associated with a date or timestamp for efficient tracking. Versioning helps document changes to the model and helps control all changes applied to a model, allowing the identification and recovery of a previous version when needed. Model version controls are typically documented and include tracking of the changes and data inputs made in each model revision. See
Chapter 7, Section 7.5.5
of this manual for definitions of no-build and build.3.3.6 Forecasting with Travel Demand Model Outputs (TDM Outputs)
TxDOT and 23 MPOs collaborate in the transportation planning process and in the development of TDM outputs (TDM outputs) and their inputs. These 23 MPOs are listed on the following page. The MPO TDM outputs can be referenced to determine corridor growth rates for projects, if available. Outside these MPO boundaries, TPP’s SAM can be referenced to determine growth rates for projects. SAM involves travel demand modeling at a statewide level. It includes different passenger and freight modes and the interaction among those modes. Access to the MPO TDM and the SAM needs a data request.
There are different types of TDM, which include 4-step/trip-based models and activity-based models (ABM). The traditional 4-step model includes trip generation, trip distribution, mode choice, and traffic assignment for a single OD pair from one traffic analysis zone (TAZ) to another. Conversely, ABMs examine continuing trips from one zone to another over time.
The TDMs available through an MPO are as follows:
- Abilene MPO
- Amarillo MPO
- Bryan-College Station MPO
- Capital Area MPO
- Corpus Christi MPO
- El Paso MPO
- Houston-Galveston Area Council
- Killeen-Temple MPO
- Laredo & Webb County Area MPO
- Longview MPO
- Lubbock MPO
- Permian Basin MPO
- North Central Texas Council of Governments
- Rio Grande Valley MPO
- San Angelo MPO
- Alamo Area MPO
- Sherman-Denison MPO
- South East Texas Regional Planning Commission
- Texarkana MPO
- Tyler Area MPO
- Victoria MPO
- Waco MPO
- Wichita Falls MPO
For non-attainment zones, only the approved TDM developed, calibrated, and validated by MPOs can be used. MPOs in the nonattainment zones are:
- El Paso MPO (El Paso area)
- Houston-Galveston Area Council (Houston-Galveston area)
- North Central Texas Council of Governments (Dallas-Fort Worth area)
- South East Texas Regional Planning Commission (Beaumont-Port Arthur area)
A TDM with project details is necessary for project level analysis for major investment type studies or a project that changes the MPO’s approved plan. Forecasting with a TDM output is also applicable in special cases, such as for a new route location; where historical data is not available; or when considerable development and land use changes are expected in the project area in the future. Travel demand modeling includes the selection of an applicable model, calibration to local conditions, validation of model results, and revisions of forecast volumes. A TDM output is calibrated for regional trip generation, trip distribution, mode choice, and assignment. TDM outputs can have inconsistencies on a link-by-link basis since these models are not calibrated at the link level. Therefore, further adjustments or post-processing of the model’s daily or peak-period outputs are typically applied prior to use in corridor or project analysis. Detailed travel demand modeling methodologies are described in National Cooperative Highway Research Program (NCHRP) Report 716 Travel Demand Forecasting: Parameters and Techniques.
It is recommended that TDM outputs and growth rates be compared with other sources, such as historical data, adjacent projects, past projects, state demographer forecasts, and US Census data population. Differences in volumes more than 10% for freeways, 15% for arterials, and 20% for ramps or low volume roads may need to be further evaluated and documented to explain the discrepancy. If no model is available for the project, then see
Section 3.3.7.
When forecasting volumes with a TDM, the existing year of a TDM coincides with the date the data was collected. For example, a TDM that uses census data for population information would have a base year that was the same as the census data year.
When forecasting traffic volumes for new locations (e.g., new routes through greenfield), it is recommended that a diversion analysis is conducted. Diversion analyses are typically conducted for a proposed highway or bypass, proposed frontage roads, ramp reversals, proposed Texas U-turns, and proposed land use development. TxDOT’s TPP Traffic Forecasting Analysis SOPs and Guide outlines how to complete a diversion analysis. Coordinate with the TxDOT project manager to gain access to the latest documents.
TDMs forecast travel demand using the following traditional four-step model:
- Trip GenerationEstimates the number of trips generated and attracted to a TAZ. The NCHRP Report 716: Travel Demand Forecasting: Parameters and Techniques document can be used for trip generation when developing a model. For validation, the analyst can use the Travel Model Improvement Portal (TMIP) Travel Model Validation and Reasonableness Checking Manual.
- Trip DistributionEstimates the number of trips TAZs. NCHRP 716 can be used for trip distribution when developing a model.
- Mode ChoiceAssigns each trip’s mode of transportation. Typical modes include private vehicles, public transit, bicycle, and walking.
- Trip AssignmentAssigns trips between zones to a route in the network.
3.3.7 Forecasting Without Travel Demand Model Outputs
Forecasting volumes without a TDM is a fourstep process:
- Obtain existing volumes
- Determine the growth rate
- Apply growth rate to the existing volumes
- Other considerations
3.3.7.1 Obtain Existing Volumes
Existing volume considerations are discussed previously in this chapter, under
Section 3.2
. These considerations include traffic data factors, seasonal factors, historical factors, peak hour/period selection, disruptive events, traffic balancing, post processing, and validation. Existing data can be obtained from various sources, including the TxDOT STARS database, MPO counts, the statewide planning map, or big data. For more information on data collection, see
Chapter 2.
3.3.7.2 Determine Growth Rate
The growth rate is a critical component needed to forecast traffic volumes. It can be determined using various methods. All methods listed in this section can be used to determine growth rate. The growth rate may vary from method to method, so it is recommended that multiple methods be checked for validation purposes. If needed, work with the District, TPP, and DES to develop interim growth rates. Three methods of determining growth rate are as follows:
- Historical traffic growth data
- Analyze traffic volumes over time at a particular location. Obtaining historical traffic volumes is discussed inChapter 2.
- Use of the linear regression spreadsheet provided inAppendix D, Section 4 – Regression Calculationsis suggested to calculate historical traffic growth rates.
- Population growth data
- Analyze population growth from multiple years to determine the traffic volume growth rate over time. Population data can be found in the US Census data or in the state demographer forecasts.
3.3.7.3 Apply Growth Rate to Existing Volumes
Apply the calculated growth rate to the existing volumes to develop traffic projections. The three components of the calculation are the existing volumes, the growth rate, and the number of years.
3.3.7.4 Other Considerations
- Planned developments
- If there are developments planned near the project location, account for growth impacts of the developments.
- Adjacent projects
- Adjacent roadway projects may impact traffic growth. Account for them during the traffic forecasting process.
- Complete the traffic projections methodology outline inAppendix D, Section 2 – Traffic Projections Methodology Memorandum Outline
For additional guidance on traffic volume and forecasting, refer to the TxDOT TPP Traffic Forecasting Analysis SOPs and Guide. Coordinate with the TxDOT project manager to gain access to the latest documents.