17.3.3 Animation
Microsimulation animates individual trajectories from the model to demonstrate traffic operations and potential solutions. Animation is an effective visual tool to present traffic analysis results to non-technical audiences or to communicate complex geometries or alternative intersections. Animations can be created from portions of simulation results that most accurately illustrate results and findings. Effects of traffic operations improvement alternatives compared side-by-side using animations can be presented at public meetings or on project websites to further the goals of the project. Each side-byside display can be prepared with the same traffic load to provide the most accurate comparison. It is recommended that animation only be used to enable a general understanding of operations – glitches or incorrect coding could cause the public to be distracted by insignificant details that are not representative of the proposed operations solution.
Animations can be used to complement graphics and/or tables but may not serve as the only method to communicate results for a study. Animation provides only a qualitative assessment of an alternative for a limited timeframe. Additionally, a simulation run shows a single output, while measures of effectiveness are typically calculated using the averages of multiple runs.
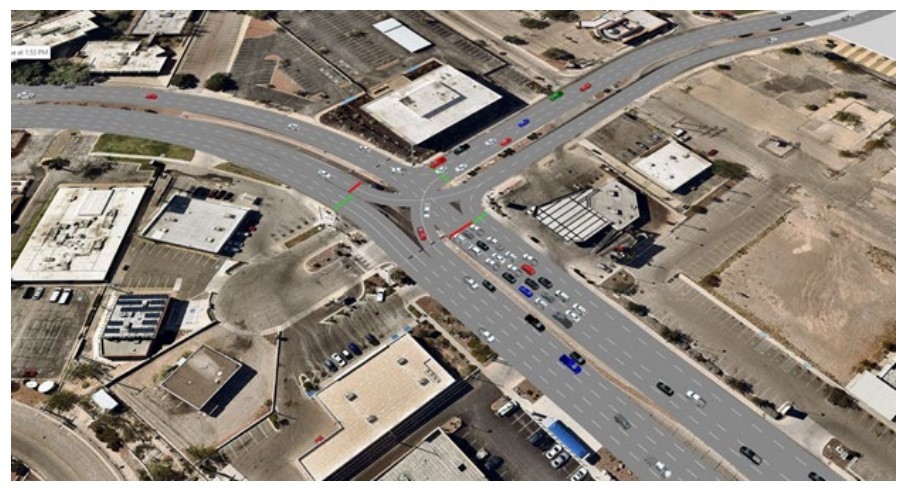
When presented in reports, screenshots of animations can be supported with explanatory text and descriptions. A screenshot of an animation from a Vissim model is shown in to illustrate a CGT.
Figure 17-3: Screenshot of a Vissim Animation