17.3.2 Graphical Presentation
Diagrams and illustrations can show the results and allow the reader to draw general conclusions without reading the narrative. These graphics are an effective resource for quickly communicating assumptions, findings, and recommendations.
Common graphical exhibits in reports include:
- Area, land use, and zoning maps;
- Turning movements at intersections;
- Local streets and highway system;
- Lane schematics;
- Link-node diagrams;
- Circulation routes; and
- Centerline alignments
These graphical exhibits can be generated in tools such as Tableau, GIS, or a database inventory/repository.
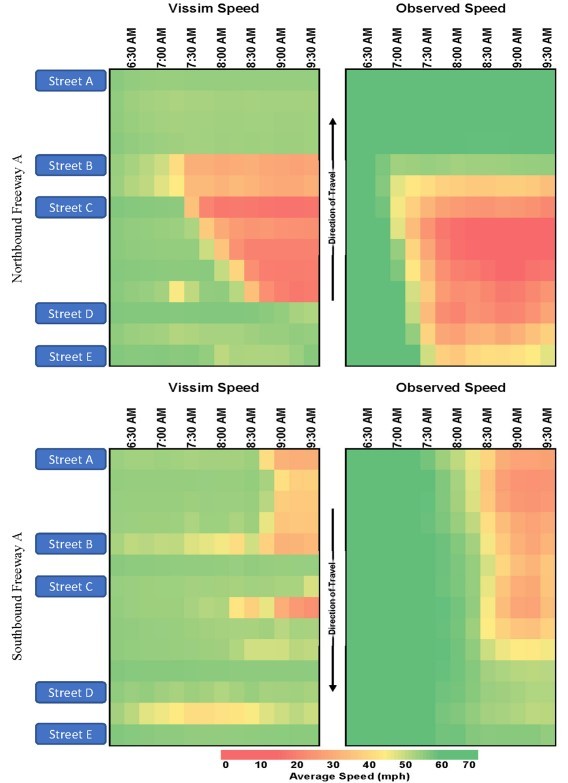
To maximize readability and effectiveness, report illustrations can include text of a reasonable font size and be limited to three layers of information, such as average speed by location and time. shows an
example
of data in a graphical formatFigure 17-2: Example of Speed Data as Graphical Presentation