14.2.1 Pedestrian
Selecting the correct methodology or tool for pedestrian analysis depends on several factors, including pedestrian facility type, anticipated delay caused by pedestrian facilities to other modes, perceived safety, comfort, and convenience of the pedestrian facilities, and expected volume of pedestrians on facilities. A pedestrian analysis methodology selection flowchart is provided in to guide the selection of pedestrian analysis methodologies. Refer to TxDOT’s RDM Chapter 7, Section 3 for information on pedestrian facility design. See
Appendix O, Section 5 – External References (Reference 3)
for the Texas Bicycle and Pedestrian Count Exchange which includes bicycle and pedestrian data counts. The pedestrian analysis subsection includes methodologies from the following resources/tools. Key notes are provided under each resource.
- HCM and the HCS;
- Provides information for various pedestrian analysis methodologies
- Methodologies emphasize pedestrian density and pedestrian-to-vehicle or pedestrian-to-bicycle interactions
- Application of HCM methodologies as seen in the HCS (i.e., signalized intersections and urban street segments) are emphasized in this chapter.
- PLTS;
- Adaptation of the Mineta Transportation Institute’s Bicycle Level of Traffic Stress (BLTS) Report
- Comparable to an assessment in which various pedestrian facilities are classified based on connectivity, perceived comfort, and perceived safety criteria
- Microsimulation; and
- Guidelines on when to use microsimulation for pedestrian analysis
- Microsimulation may be used to create animations and analyze the interaction between pedestrians and vehicles, but it does not analyze the perceived safety and comfort of pedestrian facilities
- Various Safety Guidelines
- External resources, such as the ones provided inAppendix O, Section 2 – Pedestrian and Bicycle Safety Resources,can be used for pedestrian facility improvements via countermeasure selection and scenario-specific enhancements
See for various pedestrian facilities and their descriptions.
Facility Type | Definitions/Description |
|---|---|
Sidewalk | Sidewalks are located parallel and in proximity to roadways |
Walkways | Walkways are “similar to sidewalks in construction… but they are located well away from the influence of automobile traffic |
Pedestrian Zones | Pedestrian zones are “streets that are dedicated to pedestrian-only use on a full- or part-time basis |
Queuing Areas | Queuing areas are places where pedestrians stand temporarily while waiting to be served, such as at the corner of a signalized intersection. In dense standing crowds, there is little room to move, and circulation opportunities are limited as the average space per pedestrian decreases. |
Crosswalk | Pedestrian crosswalks, whether marked or unmarked, provide connections between pedestrian facilities across sections of roadway used by motorized vehicles, bicycles, and transit vehicles. |
Underpass and Overpass | Overpasses and underpasses provide a grade-separated route for pedestrians to cross wide or high-speed roadways, railroad tracks, busways, and topographic features. |
Stairway | Stairways are sometimes used to help provide pedestrian connectivity in areas with steep hills, employing the public ROW that would otherwise contain a roadway. |
Shared Pedestrian-Bicycle Path | Shared pedestrian paths typically are open to use by nonmotorized modes such as bicycles, skateboards, and inline skaters. Shared-use paths often are constructed to serve areas without city streets and to provide recreational opportunities for the public. |
14.2.1.1 HCM and Related Software
The HCM-based software HCS is used for pedestrian analysis scenarios as described in .
The HCM contains methodologies (including formulas for calculating LOS) for several pedestrian facility types (see ), but the HCS only analyzes urban street segments, Two-Way Stop-Controlled (TWSC) intersections, and signalized intersections. For street segment analysis, the HCM uses pedestrian density to determine LOS. As such, it is recommended that the HCM methodology for street segment analysis only be considered for pedestrian facilities with high pedestrian volumes (e.g., suburban residential, greenbelts, parks/plazas, low-density commercial, central business districts, mixed-use developments, tourist destinations, outdoor shopping centers). HCS (or similar software tool) is recommended for analysis of pedestrian facilities at signalized intersections. LOS D is recommended as a minimum target for signalized crossings and street segments.
While pedestrian analysis can be conducted by hand for most pedestrian facilities covered in the HCM, PLTS analysis is recommended for most facilities, as described in .
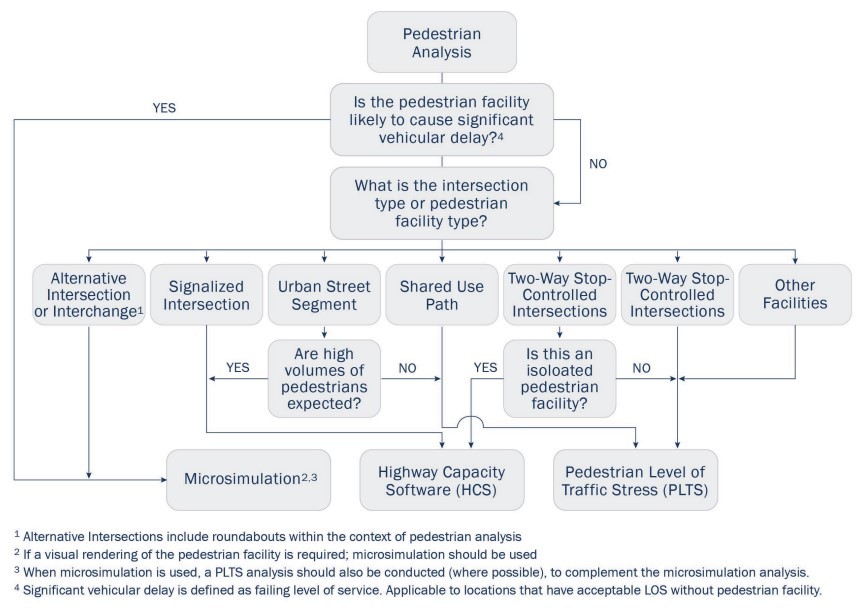
Figure 14-1: Pedestrian analysis methodology/tool selection flowchart
Facility Type | HCM Chapter and Section Number |
|---|---|
Urban street facilities | 16.4 |
Urban street segments | 18.4 |
Signalized intersections | 19.5 |
Two-way stop-controlled intersections | 20.5 |
All-way stop-controlled intersections | 21.5 |
Roundabouts | 22.5 |
Ramp terminals and alternative intersections | 23.B.4 |
Off-street facilities | 24.3, 24.4 |
To conduct a pedestrian analysis of signalized intersections, the inputs below are collected and entered into the corresponding fields on the HCS. Definitions of multimodal inputs are found in the HCS User Guide. Traffic inputs for the intersection will impact LOS calculations for the analysis and are entered.
- Permitted left-turn flow, veh/h;
- Mid-segment 85th % speed, mi/h;
- Number of right-turn islands;
- Walkway width, ft;
- Crosswalk width, ft;
- Corner radius, ft;
- Outgoing pedestrian volume, ped/h;
- Incoming pedestrian volume, ped/h;
- Circulating ped volume, ped/h;
- Rest-in-walk enabled;
- Pedestrian signal head; and
- Crosswalk closed
HCM defines pedestrian LOS at signalized intersections using a LOS Score. LOS thresholds for pedestrians are presented in .
LOS | LOS Score |
|---|---|
A | ≤1.50 |
B | >1.50-2.50 |
C | >2.50-3.50 |
D | >3.50-4.50 |
E | >4.50-5.50 |
F | >5.50 |
To conduct a pedestrian analysis of urban street segments, the inputs shown below are collected and entered into the corresponding fields on the HCS. Definitions of multimodal inputs are found in the HCS User Guide. To view results, print the “segments report” located in the HCS.
- Two-way pedestrian volumes, ped/h;
- Pedestrian waiting delay, s/ped;
- Pedestrian free-flow speed, ft/s;
- Downstream intersection width, ft;
- Sidewalk presence;
- Inside object effective width, ft;
- Outside object effective width, ft;
- Buffer width, ft;
- Nearest signal distance, ft;
- Sidewalk length adjacent to window, proportion;
- Sidewalk length adjacent to building, proportion; and
- Sidewalk length adjacent to fence, proportion
shows the HCM LOS criteria for pedestrians for urban street segments (linked-based). The overall segment pedestrian LOS uses the higher or worse of the LOS letter scores resulting from the average pedestrian space on the sidewalk and the segment pedestrian LOS score.
SegmentBased Pedestrian LOS Score | Segment-Based LOS by | Link-Based Pedestrian LOS | ||||||
|---|---|---|---|---|---|---|---|---|
Average Pedestrian Space (ft 2 /p) | ||||||||
>60 | >40-60 | >24-40 | >15-24 | >8-15 | ≤8.0 1 | Link-Based LOS Score | LOS | |
≤2.00 | A | B | C | D | E | F | ≤1.50 | A |
>2.00- 2.75 | B | B | C | D | E | F | >1.50-2.50 | B |
>2.75- 3.50 | C | C | C | D | E | F | >2.50-3.50 | C |
>3.50- 4.25 | D | D | D | D | E | F | >3.50-4.50 | D |
>4.25- 5.00 | E | E | E | E | E | F | >4.50-5.50 | E |
>5.00 | F | F | F | F | F | F | >5.50 | F |
1
In cross-flow situations, the LOS E/F threshold is 13ft2
/p14.2.1.2 Pedestrian Level of Traffic Stress (PLTS)
PLTS is used for pedestrian analysis scenarios as described in .
A PLTS analysis is conducted by taking inventory of existing/proposed pedestrian facilities. The inventory is used to gather relevant information about each pedestrian facility (e.g., sidewalk width, adjacent roadway speed, buffer width between pedestrian facility and vehicular roadway, etc.). Inventory data is collected, compared to predefined PLTS classifications for each roadway characteristic, and used to assign each facility an overall PLTS classification that describes safety, comfort, and convenience (see ). The steps for a PLTS analysis are shown in . For detailed steps on conducting a PLTS analysis, see
Section 14.2.1.2.1
.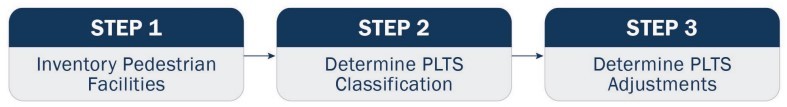
Figure 14-2: Steps in a PLTS analysis
The intent of a PLTS analysis is to determine individual pedestrian facility deficiencies and connectivity gaps in a network to prioritize pedestrian facility improvements. A PLTS analysis is used at all levels of project development.
The four PLTS classifications that are typically assigned are PLTS 1 (the best rating), PLTS 2 (the minimum standard for most pedestrian facilities), PLTS 3 (the first failing rating), and PLTS 4 (the worst rating). The four classifications and their definitions are shown in .
Classification | Classification Characteristics |
|---|---|
PLTS 1 | Pedestrian facilities with this classification have little to no traffic stress. These facilities are perceived as safe, open, and comfortable. Sidewalks are in good condition and are either far from vehicles or are near lower vehicle speeds and volumes. These facilities are suitable for users of all ages and abilities. This is the best classification. |
PLTS 2 | Pedestrian facilities with this classification have a low level of traffic stress caused by sidewalks in fair condition or proximity to higher speeds or higher volumes of vehicles. These facilities are suitable for most ages and abilities. This is the minimum standard for most pedestrian facilities. |
PLTS 3 | Pedestrian facilities with this classification represent facilities with a medium level of traffic stress caused by small buffers between sidewalks and the road, fair to low quality sidewalk conditions, and higher vehicle speeds or volumes. These facilities are suitable for some able-bodied adults. This is the first failing classification. |
PLTS 4 | Pedestrian facilities with this classification represent facilities with the highest levels of traffic stress. They often have very low quality or non-existent sidewalks, high vehicle speeds and volumes, and no buffer. These facilities are only suitable for highly confident able-bodied adults. This is the worst classification. |
14.2.1.2.1 Step One: Template Selection and Data Collection for Pedestrian Facility
The PLTS Inventory and Classification template provided in
Appendix O, Section 1 – Pedestrian Level of Traffic Stress Inventory and Classification
) has two tables, one for signalized midblock crossings and segment facilities and one for unsignalized intersection crossings or unsignalized midblock crossings. This fillable template will serve as the basis for the analysis and contains information on data needs and reference tables used in the analysis. Once the correct template is selected based on facility type, collect data for the pedestrian facility in question. Use the PLTS Inventory and Classification template discussed previously.
Characteristics to inventory depend on the facility type and are shown here:
- If the facility is a signalized midblock crossing or segment facility, inventory the following characteristics:
- Sidewalk width
- Sidewalk condition
- See footnotes for definitions.
- Buffer type
- See footnotes for definitions.
- Buffer width
- See footnotes for definition.
- Posted speed on adjacent vehicular roadway
- Number of adjacent roadway lanes
- See footnotes for definition.
- Adjacent land use
- See
- If the facility is an unsignalized intersection crossing or unsignalized midblock crossing, inventory the following characteristics:
- Posted speed on adjacent vehicular roadway
- Number of adjacent roadway lanes
- For roadways without a median refuge, see footnotes for definition.
- For roadways with a median refuge:
- For roadways with one to two lanes, see footnotes for definition.
- For roadways with three or more lanes, see footnotes for definition.
- ADT of adjacent vehicular roadway
- Crossing treatments
- See for definitions
14.2.1.2.2 Step Two: Determine Preliminary PLTS Classification
Use the data gathered from the facility inventory and the relevant PLTS classification tables shown on the
PLTS Inventory and Classification Template
(see Appendix O, Section 1 – Pedestrian Level of Traffic Stress Inventory and Classification
) to determine a PLTS classification. Determining the overall PLTS classification of the facility occurs in Section 14.2.1.2.3
, this step is a preliminary determination of PLTS classification. The PLTS classification tables used are also shown in .A pedestrian walking route can be comprised of several individual pedestrian facilities (e.g., a sidewalk, an unsignalized midblock crossing, and a shared use path). If this is the case, data is collected for each facility and a PLTS classification assigned to each facility separately in preparation for the overall facility PLTS classification.
Facility Type | Tables Used to Determine PLTS |
|---|---|
Segment facility or signalized midblock crossing
|
|
Unsignalized intersection crossing or unsignalized midblock crossing
|
|
Sidewalk Width (ft) | Sidewalk Condition | |||
|---|---|---|---|---|
Good 1 | Fair 2 | Low 3 | No Sidewalk 4 | |
≥6 | PLTS 1 | PLTS 1 | PLTS 2 | PLTS 4 |
≥5 to <6 | PLTS 2 | PLTS 2 | PLTS 3 | PLTS 4 |
≥4 to <5 | PLTS 3 | PLTS 3 | PLTS 3 | PLTS 4 |
<4 | PLTS 4 | PLTS 4 | PLTS 4 | PLTS 4 |
1
No cracking, patching, raveling, or faulting 2
Minor cracking, patching, raveling, faulting is not greater than ½” 3
Major cracking, patching, raveling, faulting is greater than ½” 4
Travel lane, paved soil, and loose aggregate are not considered sidewalksType | Posted Speed (mph) | |||
|---|---|---|---|---|
≤25 | 30 | 35-40 | ≥45 | |
Wall 1 | PLTS 1 | PLTS 1 | PLTS 1 | PLTS 2 |
Landscaped – Thick 2 | ||||
Landscaped – Medium 3 | PLTS 1 | PLTS 1 | PLTS 2 | PLTS 3 |
Landscaped – Thin 4 | PLTS 1 | PLTS 2 | PLTS 3 | PLTS 4 |
Solid Surface – With Buffering Elements 5 | PLTS 1 | PLTS 1 | PLTS 2 | PLTS 3 |
No Buffer 6 | PLTS 2 | PLTS 3 | PLTS 4 | PLTS 4 |
1
A vertical buffer separating the pedestrian facility from the roadway (i.e., retaining wall, concrete barrier). 2
Area between the edge of sidewalk closest to the road and back of curb is landscaped with items that will prevent vehicles from crossing buffer (e.g., large mature trees, large rocks, large ditch). 3
Area between edge of sidewalk and back of curb is landscaped with items that will prevent most vehicles from crossing buffer (e.g., small/young trees, medium-sized bushes, medium-sized rocks, medium-sized ditch). 4
Area between edge of sidewalk and back of curb is landscaped with items that will prevent some vehicles from crossing buffer (e.g., small bushes, small rocks, small ditch). 5
Area between edge of sidewalk and back of curb is a solid surface that has buffer elements along the facility (e.g., illumination poles, electric poles, benches, bicycle racks). 6
Sidewalk is less than 8 feet wide and edge of sidewalk and back of curb are touching. On-street parking and bicycle lanes are not considered buffer types but do contribute to the buffer width.Buffer Width 1 | Posted Speed (mph) | |||
|---|---|---|---|---|
≤25 | 30 | 35-40 | ≥45 | |
≥25 | PLTS 1 | PLTS 1 | PLTS 1 | PLTS 1 |
≥15 to <25 | PLTS 1 | PLTS 1 | PLTS 1 | PLTS 2 |
≥10 to <15 | PLTS 1 | PLTS 1 | PLTS 2 | PLTS 3 |
≥5 to <10 | PLTS 1 | PLTS 2 | PLTS 3 | PLTS 4 |
<5 | PLTS 2 | PLTS 3 | PLTS 4 | PLTS 4 |
1
Buffer width is the summation of on-street width (i.e., on-street parking width, bicycle facility width, and roadway shoulder width), and off-street buffer width (i.e., distance between the edge of sidewalk closest to the road and back of curb).Adjacent Roadway Lanes 1 | Posted Speed (mph) | |||
|---|---|---|---|---|
≤25 | 30 | 35-40 | ≥45 | |
2 | PLTS 1 | PLTS 1 | PLTS 2 | PLTS 3 |
3 | PLTS 1 | PLTS 2 | PLTS 2 | PLTS 3 |
4 | PLTS 2 | PLTS 2 | PLTS 3 | PLTS 3 |
5 | PLTS 2 | PLTS 3 | PLTS 3 | PLTS 4 |
6 | PLTS 3 | PLTS 3 | PLTS 4 | PLTS 4 |
1
For signalized intersection crossings or midblock crossings, this is the total number of lanes on the segment (e.g., a roadway with two lanes in each direction and a two-way left turn lane would have an adjacent roadway lanes value of 5).Adjacent Land Use | PLTS Classification |
|---|---|
Suburban residential, greenbelts, parks/plazas, low-density commercial | PLTS 1 |
Urban residential, medium density commercial, mixed land use, schools, hospitals, government buildings | PLTS 2 |
Light industrial, auto-driven commercial, central business district (CBD) | PLTS 3 |
Heavy industrial, adjacent to freeway interchanges or freeway facilities | PLTS 4 |
Posted Speed | Adjacent Roadway Lanes 1 | |||||
|---|---|---|---|---|---|---|
2 Lanes | 3+ Lanes | |||||
<5,000 vpd | 5,000 – 9,000 vpd | >9,000 vpd | <8,000 vpd | 8,000 – 12,000 vpd2 | >12,000 vpd | |
≤25 | PLTS 1 | PLTS 3 | PLTS 3 | PLTS 3 | PLTS 3 | PLTS 4 |
30 | PLTS 1 | PLTS 3 | PLTS 4 | PLTS 3 | PLTS 4 | PLTS 4 |
35-40 | PLTS 3 | PLTS 4 | PLTS 4 | PLTS 4 | PLTS 4 | PLTS 4 |
≥45 | PLTS 1 | PLTS 2 | PLTS 3 | PLTS 3 | PLTS 3 | PLTS 4 |
1
For unsignalized intersection crossings or midblock crossings without a median refuge, this is the total number of lanes on the segment (e.g., a roadway with two lanes in each direction and a two-way left turn lane would have an adjacent roadway lane value of 5). 2
Use this column when ADT is unavailablePosted Speed | Adjacent Roadway Lanes 1 | |||
|---|---|---|---|---|
1 Lane | 2 Lane | |||
Any | <5,000 vpd | 5,000 – 9,000 vpd 2 | >9,000 vpd | |
≤25 | PLTS 1 | PLTS 1 | PLTS 2 | PLTS 2 |
30 | PLTS 2 | PLTS 2 | PLTS 2 | PLTS 2 |
35-40 | PLTS 2 | PLTS 2 | PLTS 2 | PLTS 3 |
≥45 | PLTS 3 | PLTS 3 | PLTS 3 | PLTS 4 |
1
For unsignalized intersection crossings or midblock crossings with a median refuge, this is the maximum number of lanes crossed in one direction (e.g., a roadway with two lanes in both directions would have an adjacent roadway lane value of 2).2
Use this column when ADT is unavailablePosted Speed | Adjacent Roadway Lanes 1 | |||
|---|---|---|---|---|
3 Lanes | 4+ Lanes | |||
<8,000 vpd | 8,000 – 12,000 vpd 2 | >12,000 vpd | Any | |
≤25 | PLTS 1 | PLTS 2 | PLTS 3 | PLTS 4 |
30 | PLTS 2 | PLTS 2 | PLTS 3 | PLTS 4 |
35-40 | PLTS 3 | PLTS 3 | PLTS 4 | PLTS 4 |
≥45 | PLTS 4 | PLTS 4 | PLTS 4 | PLTS 4 |
1
For unsignalized intersection crossings or midblock crossings with a median refuge, this is the maximum number of lanes crossed in one direction (e.g., a roadway with two lanes one direction and three lanes in the other direction would have an adjacent roadway lane value of 3). 2
Use this column when ADT is unavailable.14.2.1.2.3 Step Three: Determine PLTS Adjustments
If the facility is a signalized midblock crossing or segment facility, the overall PLTS classification is the lowest of the individual classifications, or highest traffic stress classification, determined in step two (e.g., a facility with a PLTS 4 as the lowest classification in any of the characteristics would have an overall PLTS classification of 4).
If the facility is an unsignalized intersection crossing or unsignalized midblock crossing, the overall PLTS classification is the classification determined in step two, adjusted for any crosswalk enhancements. The crosswalk enhancement adjustments are shown in .
A pedestrian walking route comprised of several individual pedestrian facilities (e.g., a sidewalk, an unsignalized midblock crossing, and a shared use path) usually has a PLTS classification given to each facility and the worst rating governs the whole route. A pedestrian route with a sidewalk (PLTS 3), midblock crossing (PLTS 2), and shared-use path (PLTS 1) would have an overall PLTS 3 classification.
Treatment 1 | Adjustment |
|---|---|
High-visibility crosswalk markings, parking restrictions on crosswalk approach, adequate nighttime lighting levels, and crossing warning signs | -0.5 |
Raised crosswalk | -1.0 |
Advance Yield Here To (Stop Here For) pedestrian sign and yield (stop) line | -0.5 |
In-street pedestrian crossing sign | -0.5 |
Curb extension | -0.5 |
Pedestrian refuge island | -1.0 |
RRFB | -1.0 |
PHB | -1.0 |
1
The maximum reduction is two classification levels, or PLTS 2, whichever comes first. A PLTS 2 classification is recommended as a minimum target for most pedestrian facilities. For pedestrian facilities near hospitals, schools, or other locations with vulnerable or young populations, a PLTS 1 classification is recommended.
For
examples
of an inventory and PLTS classification for a pedestrian facility on a segment and for a pedestrian facility at a midblock crossing, see and , respectively. These two examples occur on independent pedestrian facilities and the assigned PLTS classifications are also independent.In the first
example
shown in , the pedestrian accommodation was a segment facility (i.e., sidewalk adjacent to an arterial). The first step was to determine which inventory and classification template table to use (see Appendix O, Section 1 – Pedestrian Level of Traffic Stress Inventory and Classification
). The upper table in the PLTS Inventory and Classification Template was used based on the footnote at the bottom of the table that states, “Applicable to signalized midblock crossings and segment facilities.” Next, an inventory was conducted for the facility in question, the collected data was based on the PLTS Inventory and Classification Template
chosen, and for this example
, included the following data:- Sidewalk condition and width;
- Determined to be six-foot wide and in fair condition for this example
- Buffer type and width;
- Determined there was “No Buffer” type as defined in , but an overall buffer width of one foot
- Adjacent roadway speed and number of lanes; and
- Determined the speed of the adjacent road to be 40mph and the number of adjacent lanes to be six
- Adjacent land use type
- Determined to be suburban residential
This collected data was written in the appropriate cells on the PLTS Inventory and Classification Template. Next, the collected data was used to determine the PLTS classification of the facility based on individual characteristics of the facility (i.e., PLTS classification based on sidewalk conditions, buffer type, buffer width, adjacent roadway characteristics, and adjacent land use type). The PLTS classification for the sidewalk characteristic was determined using . A sidewalk with a six-foot width in fair condition is given a PLTS 1 classification. This classification is written in the appropriate box on the template and the next characteristic is classified, until all the characteristics have been classified.
The last step is to determine the overall facility PLTS classification. This is done by selecting the worst rating given for any of the individual PLTS classifications. In this example, the buffer type and buffer width both have PLTS classifications of 4, which means the overall PLTS classification of this facility is PLTS 4.
Facility1: Segment along a principal arterial | ||||
|---|---|---|---|---|
Characteristics | Value | PLTS Reference Table | PLTS Classification | |
Width (ft) | 6 | |||
On-Street Width | 1 | |||
Total Width | 1 | |||
Adjacent Roadway | Speed (mph) | 40 | Used in various tables | PLTS 3 |
Overall PLTS Classification | PLTS 4 | |||
1
Applicable to signalized intersection crossings and segment facilitiesIn the second
example
shown in , the pedestrian accommodation was an unsignalized midblock crossing. The first step was to determine which inventory and classification template to use (see Appendix O, Section 1 – Pedestrian Level of Traffic Stress Inventory and Classification
). The bottom table in the PLTS Inventory and Classification Template was used based on the footnote at the bottom of the table that states, “Applicable to unsignalized intersection crossings or midblock crossings (includes midblock crossings with PHB or RRFB)”. Next, an inventory was conducted for the facility in question, the collected data was based on the PLTS Inventory and Classification Template
chosen, and for this example included the following data:- Adjacent roadway
- Speed;
- Determined to be 35 mph
- Number of lanes;
- Determined to be 35 mph
- ADT (vpd); and;
- Determined to be 14,972
- Crossing treatments
- Determined that there is an RRFB and crosswalk markings
This collected data was written in the appropriate cells on the PLTS Inventory and Classification Template. Next, the collected data was used to determine the PLTS classification of the facility based on a single reference table. Although there are three reference tables on the PLTS Inventory and Classification template, only one is used, based on number of lanes, and presence of a center raised median. For this
example
, was used because there is no raised median. Based on , an unsignalized midblock crossing with four lanes, a speed of 35mph, and an ADT of 14,972, is given a PLTS 4 classification. The last step in this example was to consider the positive effects that crossing treatments can have on this crossing. It was determined that this unsignalized crossing has an RRFB and crosswalk markings. Using , a 1.5 reduction in PLTS classification is used due to the RRFB and crossing sign present at this crossing. Rounding up to the nearest whole number results in a PLTS 3 classification for this facilityFacility2: School crossing near high school | ||||
|---|---|---|---|---|
Characteristic | Value | PLTS Reference Table | PLTS Classification | |
Number of Lanes | 4 | |||
ADT (vpd) | 14,972 | |||
Raised Median | No | |||
Overall PLTS Classification | PLTS 3 | |||
2
Applicable to unsignalized intersection crossings or unsignalized midblock crossings (includes midblock crossings with PHB or RRFB)14.2.1.3 Microsimulation
Microsimulation is used for pedestrian analysis scenarios as described in .
Microsimulation is often used if the pedestrian facility interacts with motor vehicles (e.g., a midblock crossing across an arterial) and the interaction is expected to cause considerable pedestrian or vehicular delay. Microsimulation does not analyze safety or perceived comfort of a pedestrian facility; therefore, a microsimulation (microscopic) analysis is typically paired with a PLTS analysis.
A pedestrian crosswalk can be coded at an intersection using links that match the width and location of the crosswalk in the field that cross over the leg of the intersection. It is a best practice to use a different display type for pedestrian crosswalk links to show that these are separate from the vehicle network links. Signal heads and detectors are used on the pedestrian crosswalk links for pedestrian movements controlled by a pedestrian signal. Conflict areas are coded between vehicle and pedestrian links. Pedestrians are given priority by coding the conflict area for pedestrian links green and coding the overlapping vehicle links red.
Animations of pedestrian facilities can be created with microsimulation (microscopic) tools, and these animations are a valuable resource in a pedestrian analysis. Animations are not necessary for any pedestrian facility analysis but could be recommended based on project complexity and level of detail. Animations are not acceptable as a standalone form of analysis and are to be used only as a complement to a PLTS, HCS, or traditional microsimulation (microscopic) analysis.
For information on coding detectors, conflict areas, and links for pedestrian analysis, see
Chapter 13
. If using Vissim to conduct a pedestrian analysis, refer to the Vissim user manual for information on specific best practices and guidance.
14.2.1.4 Safety
In addition to the safety emphasis found in the PLTS analysis, additional resources on pedestrian facility safety are provided in
Appendix O, Section 2 – Pedestrian and Bicycle Safety Resources
, which contains information about countermeasure selection tools and crash analysis tools. The document also lists external reports that focus on pedestrian safety at various facilities. TxDOT has created the Pedestrian Safety Action Plan (PSAP) to address the rising number of pedestrian related crashes. A link to the PSAP is provided in Appendix O, Section 5 – External References (Reference 4)
. A link to the PSAP screening tool is provided in Appendix O, Section 5 – External References (Reference 5)
. While predictive safety analysis for pedestrian facilities is limited as of 2024, the NCHRP Report 1784 is developing crash prediction model SPFs for use in the Second Edition of the HSM. For further information on the application of the HSM and other safety considerations, see
Chapter 5
and Chapter 6
.