13.5.2 Acceptability Criteria
Effective calibration demands several performance measures for calibration. This section summarizes the
FHWA Traffic Analysis Toolbox, Volume III (2004)
and FHWA Traffic Analysis Toolbox, Volume III (2019)
Guidelines for calibration. For all FHWA related projects, it is necessary to use the FHWA 2019 Guidelines. For non-FHWA projects, calibration criteria is typically determined during project scoping and based on discussions with the TxDOT project manager. If a non-FHWA project is in an urban area and the data is available, it is recommended to use the FHWA 2019 Guidelines.13.5.2.1 FHWA Traffic Analysis Toolbox, Volume III (2004) Requirements
The previous FHWA 2004 Guidelines provided guidance on calibrating travel times and throughputs. To consider a model calibrated, at least two metrics are calibrated. The calibration criteria only apply to the peak hour.
13.5.2.2 Travel Time
Travel time calibration criteria are separated into two types of roadway facilities: uninterrupted flow and interrupted flow. To calibrate a model, the allowable travel time variation is measured using the equations shown in
Facility Type | Equation |
|---|---|
Free-Flowing | 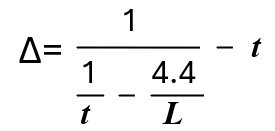 |
Interrupted Flow | 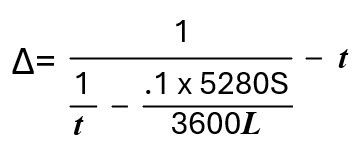 |
∆ = Allowable Travel Time Variation (+/- seconds)
t = Real-World Travel Time (seconds)
L = Length (ft)
S = Free Flow Speed (FFS) in mph; Posted Speed can be used for FFS if unknown
13.5.2.3 Throughput
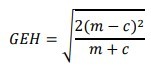
To measure and compare field data and simulation throughputs, this guidance uses the Geoffrey E. Havers (GEH) formula. The GEH statistic is typically calculated for mainline segments and ramps. It is recommended that calibration of the model using the GEH formula is calculated to a value of 3 or lower:
where,
m = output traffic throughput volumes from the simulation model (veh/h/ln)
c = traffic throughput volumes based on field data (veh/h/ln)
Additional criteria for GEH statistics are shown in and .
GEH Statistics | Guidance |
|---|---|
< 3.0 | Acceptable Fit |
3.0 to 5.0 | Acceptable for Local Roadway Facilities |
> 5.0 | Unacceptable |
Criteria | Acceptable Targets |
|---|---|
GEH < 3.0 | All State facility segments within the calibration area |
GEH < 3.0 | All points of entry and exit locations within the calibration area |
GEH < 3.0 | All entrance and exit ramps within the calibration area |
GEH < 5.0 | At least 85% of applicable local roadway segments |
Sum of all segment flows within the calibration area | Within 5% |
13.5.2.4 FHWA Traffic Analysis Toolbox, Volume III (2019) Requirements
The FHWA 2019 Guidelines has four separate acceptability criteria. These calibration criteria are recommended for projects that involve FHWA review and approval. Each calibration criterion can be applied to all performance metrics that are being used for calibration purposes such as travel time routes, throughputs, etc.
The first two are related to sigma bands and the last two are related to accuracy. Sigma bands contain the number of outliers and inliers in the simulated results. Using graphical representation, the simulated data typically fits between the upper and lower limits of the sigma band criterion.
- Criterion I is Control for Time-Variant “Outliers”. The purpose of this criterion is to control for maximum number of outliers associated with the simulation results. To fulfill this criterion, the 2- sigma band criterion, 95 percent of all simulated data points are contained within the 2-sigma band thresholds. Note that if fewer than 20 time-intervals are used for the analysis, then a maximum of one value may fall outside of the time-variant envelope.
- Criterion II is Control for Time-Variant “Inliers”. The purpose of this criterion is to constrain the simulated results to fall closely in line with the representative day. To satisfy this criterion, the 1-sigma band criterion, 66 percent of all simulated data points are contained within the 1-sigma thresholds, and simulated results for 2 non-adjacent critical time intervals are within the time-variant envelope. below shows the time-variant envelopes for the representative day travel times for Criterion I (2 sigma band) and Criterion II (1 sigma band).
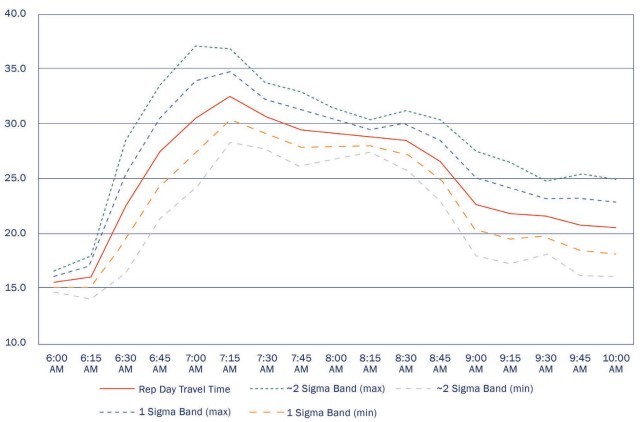
Figure 13-6: Sample Chart Plot of Variation Envelope for Travel Times from FHWA
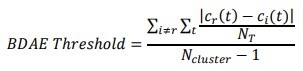
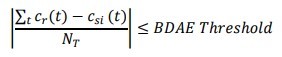
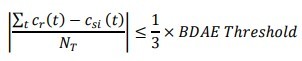
- Calibration Criterion III is the Bounded Dynamic Absolute Error (BDAE) and verifies that the data accurately captures the data from the representative day. The BDAE is calculated before comparing the simulated results against it. The following equations are used to calibrate for Criteria III and Criteria IV:
where,
Cr(𝑡) = Observed value of representative day (r) during time interval t
Ci(𝑡) = Observed value of non-representative day (i) within the cluster during time interval t
Csi(𝑡𝑡) = Simulated performance measure during time interval t
N
= Number of time intervals T
N
= Number of days in the cluster representing this travel conditioncluster
Criterion III checks the simulated data with the field data to determine whether it is an overestimate or underestimate for the calibration metrics. The following equation is used to calibrate for Criterion III:
- Calibration Criterion IV, Bounded Dynamic Systematic Error, checks for the simulated data against the field data to determine whether it is an overestimate or underestimate for the calibration metrics. The following equation is used to calibrate for Criteria IV:
A detailed
example
of the calibration criteria calculations is provided in Appendix N, Section 3 – Calibration Criteria Calculations Example
. Comparison Summary between FHWA 2004 and 2019 Guidelines:
There are several differences between the FHWA 2004 and 2019 calibration guidelines. Although, calibration is still performed on similar performance measures such as travel time, throughput, queues, etc., the approach is very different when comparing the two guidance documents. Instead of each performance measure having different sets of calibration acceptance targets, all performance measures are analyzed using the same four criteria in the FHWA 2019 Guidelines. The FHWA 2019 Guidelines also has a heavy emphasis on collecting a larger amount of data for calibration. shows a comparison between the two guidance documents.
Calibration Parameter | 2004 | 2019 |
|---|---|---|
Calibration for an average day | X | |
Calibration for a single representative day | X | |
Hourly flows (individual links and sum of all links) | X | |
Travel times (within 15%, or 1 min, if higher) | X | |
GEH statistics (individual link flows and sum of all link flows) | X | |
Visual audits (queues/bottle necks) | X | X |
Bottleneck throughputs | X | X |
Calibration for saturation flow rate | X | X |
Criterion I – Control for time-variant outliers | X | |
Criterion II – Control for time-variant “inliers” | X | |
Criterion III – Bounded Dynamic Absolute Error (BDAE) | X | |
Criterion IV – Bounded Dynamic Systematic Error | X |