13.3.3.1 Cluster Analysis and Travel Condition
13.3.3.1 Cluster Analysis and Travel Condition
Cluster analysis groups similar objects into respective categories using a statistical method. Cluster analysis determines patterns of association by grouping objects together. Cluster analysis in microsimulation develops multiple clusters that outline different types of travel conditions a road user might experience throughout the year. Examples of travel conditions include the following:
- Medium demand with high precipitation and low travel times.
- High demand, clear weather, and high travel times.
- High demand, clear weather, major incidents, and high travel times.
For cluster analysis, data from multiple sources is used to establish relationships between the different data types and determine different travel conditions. Therefore, FHWA recommends collecting up to a year’s worth of data for the different data types mentioned above. The FHWA 2019 Guidelines include a step-by-step process on how to perform cluster analysis. Perform a representative day analysis for one cluster (travel condition) and meet the calibration criteria for that. See for a graphical representation of a cluster analysis. There may be multiple clusters derived from a dataset. Work with the TxDOT project manager to determine how many of the clusters to analyze.
See
Appendix N, Section 3 – Calibration Criteria Calculations Example
for a table on representative day selection. See Appendix N, Section 5 – Lonestar Data in Cluster Analysis Case Study
for an example of how to use TxDOTs Lonestar data for cluster analysis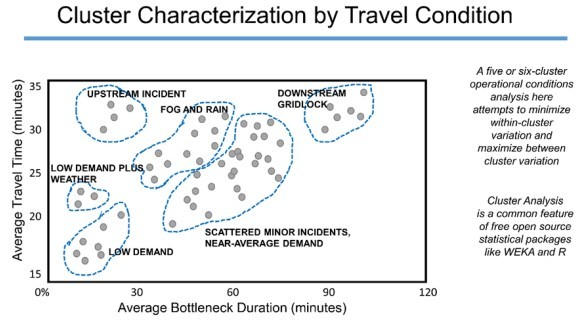
Figure 13-2: Cluster Characterization by Travel Condition
Source: FHWA Cluster Analysis Workshop