13.3 Data Collection
13.3.1 Overview
Several types of data are necessary to develop a microsimulation model. Necessary data varies on the project scope, complexity, and MOEs. The quality of data collected directly impacts the quality of the analysis, so it is crucial the data collected is reliable. As noted in
Chapter 2
of this manual, it is crucial that all data be collected within the same time frame to confirm accuracy and reliability. For guidance on the types of data, their collection methods, and resources, please see Section 2.2
. Chapter 2 of the FHWA
Traffic Analysis Toolbox, Volume III: Guidelines for Applying Traffic Microsimulation Modeling Software 2019
(FHWA 2019 Guidelines) also discusses key steps in the data collection and analysis. The steps it outlines are as follows:- Identify data sources;
- Assemble contemporaneous data;
- Verify data quality; and
- Identify travel conditions using cluster analysis
These steps are recommended to be followed for all projects that use FHWA approval and can be used for any project. For detailed guidance, refer to Chapter 2 in the Traffic Analysis Toolbox, Volume III.
13.3.2 Data Requirements Determination
It is of key importance that sufficient data be collected to calibrate and validate a microsimulation model. Loop counts, video counts, probe-based data, travel time runs, intersection TMCs, and in-person observations are typically performed when field data is collected for microsimulation models. However, with the FHWA 2019 Guidelines, the following data collection sources are recommended to be able to perform cluster analysis and determine travel conditions:
- Demand;
- Permanent count locations from STARS II within and/or adjacent to the project.
- Lonestar has data available for urban/metro Districts.
- OD data from Big Data sources or OD trip tables from TDMs to determine travel patterns.
- Weather;
- The National Weather Service (NWS) or similar sources for data on precipitation, wind speed, snow, visibility, etc.
- Incident;
- Local area traffic management centers.
- TxDOT’s CRIS data to identify crashes that occurred on the facility by time of day.
- Transit;
- Local transit authority for data related to ridership, routes, transit stops, etc. within the study area.
- Freight;
- Classification counts or permanent counters
- TxDOT’s Statewide Planning Map
- Bottleneck Throughput; and
- Stationary bottleneck location data within the study area.
- Bottleneck throughput data via traffic counts upstream and downstream of the bottleneck (within 0.5 miles of the bottleneck and upstream of any major interchanges or intersections.)
- Travel Time
- Big data sources such as INRIX or others can be used.
FHWA recommends collecting a year’s worth of data to perform cluster analysis. Collect at least 100 days of traffic data from permanent counters on STARS II website, Traffic Management Centers, Travel Times from INRIX or other Big Data sources. For projects that require FHWA review or approval, coordinate with FHWA regarding an acceptable data collection methodology if FHWA’s data collection recommendations cannot be met.
13.3.3 Standard Analysis Data
Per the FHWA 2019 Guidelines, to mirror real-world conditions, models are typically calibrated to data collected on a single day, rather than an average of multiple days. When multiple days of data are collected, the most representative day is typically selected and replicated in the model. As stated in
Chapter 2
, for microsimulation projects that require FHWA approval, such as an IAJR, FHWA recommends collecting at least a 100 days of traffic data. The TxDOT permanent count stations may be used to collect the 100 days of data. While this may not be feasible for all microsimulation analysis studies, a minimum of seven-to-14 consecutive days of ADT data is to be collected for key locations along a study corridor. Additional data collection requirements are noted in Chapter 2
.13.3.3.1 Cluster Analysis and Travel Condition
13.3.3.1 Cluster Analysis and Travel Condition
Cluster analysis groups similar objects into respective categories using a statistical method. Cluster analysis determines patterns of association by grouping objects together. Cluster analysis in microsimulation develops multiple clusters that outline different types of travel conditions a road user might experience throughout the year. Examples of travel conditions include the following:
- Medium demand with high precipitation and low travel times.
- High demand, clear weather, and high travel times.
- High demand, clear weather, major incidents, and high travel times.
For cluster analysis, data from multiple sources is used to establish relationships between the different data types and determine different travel conditions. Therefore, FHWA recommends collecting up to a year’s worth of data for the different data types mentioned above. The FHWA 2019 Guidelines include a step-by-step process on how to perform cluster analysis. Perform a representative day analysis for one cluster (travel condition) and meet the calibration criteria for that. See for a graphical representation of a cluster analysis. There may be multiple clusters derived from a dataset. Work with the TxDOT project manager to determine how many of the clusters to analyze.
See
Appendix N, Section 3 – Calibration Criteria Calculations Example
for a table on representative day selection. See Appendix N, Section 5 – Lonestar Data in Cluster Analysis Case Study
for an example of how to use TxDOTs Lonestar data for cluster analysis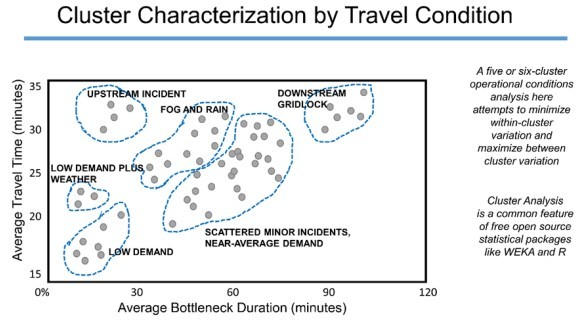
Figure 13-2: Cluster Characterization by Travel Condition
Source: FHWA Cluster Analysis Workshop
13.3.3.2 Selecting a Representative Day
13.3.3.2 Selecting a Representative Day
To build a reliable and accurate microsimulation model, it is important to calibrate to a single observed-representative day, rather than the average of multiple days of data. An average of multiple days could create unrealistic performance measures. Additionally, averaging creates the impression of weak bottlenecks with inconsistent time-dependent flow rates. To select a representative day from the travel conditions, key performance measures used in the cluster analysis are averaged at 15-minute time intervals across all days the data was collected. Then the percentage difference between the average and the observed is calculated. Based on this calculation, the representative day is selected, which is the day with the lowest percentage difference. The process of selecting a representative day is typically completed by using a cluster analysis, which helps account for variations in data caused by weather, incidents, and construction. For additional guidance on how to complete a cluster analysis, refer to Chapter 2 of the FHWA Traffic Analysis Toolbox, Volume III.
An
example
of selecting the representative day from a single cluster is provided in Appendix N, Section 3 – Calibration Criteria Calculations Example
.13.3.3.3 Base Model Development
13.3.3.3 Base Model Development
The following data is necessary for base model development:
- Road geometry (lengths, number of lanes, lane assignments, curvature);
- Traffic controls (signal timings, stop and yield sign locations, right turn on red (RTOR) designations, speed limits);
- Demand (entry volumes, turning volumes, OD tables);
- Pedestrian (volumes); and
- Transit (type, frequency, location of stops)
In addition to geometric and control data, microsimulation models also demand vehicle characteristics. These typically include:
- Vehicle Mix (% heavy vehicles, % passenger vehicles, vehicle types);
- Vehicle Dimensions; and
- Performance Characteristics
Additional information, such as driver characteristics, may be necessary:
- Driver Aggressiveness;
- Reaction Times;
- Desired Speeds; and
- Acceptable Critical Gaps