13.2 Project Scope
13.2.1 Overview
As stated in
Chapter 1
of this manual, a project scoping form is typically developed to serve as the project guidance document that includes all elements discussed in the analysis methodology. This chapter outlines scoping guidance specific to microsimulation.13.2.2 Study Limits
The study limits for a project are determined during the scoping process. The study limits incorporate the project limits plus the area of influence, which have an impact on the operations in the study area. Wherever applicable, it is recommended that the model extends a minimum of one intersection or interchange both upstream and downstream of the farthest intersection or interchange within the study area. below shows an
example
from the FHWA Interstate System Access Informational Guide of potential study limits on an interstate project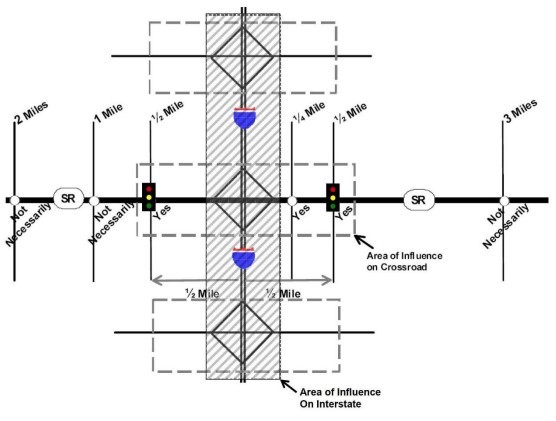
Figure 13-1: Area of Influence
Source: FHWA’s Interstate System Access Informational Guide
See
Section 13.6
of this chapter for more information about incorporating unmet demand into a microsimulation model. Preferably, travel speeds at the study limits remain near free-flow speeds throughout the analysis period. This allows the modeler to fully capture the formation and dissipation of congestion within the study area limits.13.2.2.1 Freeways
It is recommended that models extend at least one interchange (including ramp terminals) beyond the study limit in both the upstream and downstream directions. This additional area is included during the calibration and debugging process, but results are not always reported. All intersections with significant influence on the arrival patterns of vehicles entering the network are typically included in the model. If extending the study limit is not practical, additional information on capturing unmet demand is provided in
Section 13.6
.13.2.2.2 Arterials
Arterial model networks typically capture both one signalized intersection upstream and one signalized intersection downstream of the study intersections. If signalized intersections are not present, such as in rural areas, it is recommended that the network capture approximately half a mile of the arterial in both the upstream and downstream directions. Visual inspection of field data is used to determine if more of the roadway network will be included in the analysis. Like freeways, all intersections with significant influence on the arrival patterns of vehicles entering the network are included in the model. Additionally, it is recommended that all resulting congestion during the peak period be captured within the study limits. If congestion is identified on a network boundary, extend the study limits to capture the entirety of the queue. If extending the study limits is no longer practical, additional information on capturing unmet demand is provided in
Section 13.6
.13.2.3 Study Time Period
Study time periods are selected such that they include the time prior to the buildup of congestion and end after the dissipation of congestion. A simulation model is developed for a period of time that is necessary to replicate the full extent of congested traffic operations within the study area peak period or peak hour. For models that are oversaturated, the study period is typically expanded to include the buildup and dissipation of congestion. Otherwise, a peak hour analysis and seeding period (the initial time it takes for the model to represent real-world conditions) may be sufficient. The seeding period is typically at least twice the minimum amount of time that it takes one vehicle to traverse the longest extent of the network. The peak hour is defined as four consecutive 15-minute intervals of turning movement traffic count data that represents the highest traffic volume in an hour. A peak period consists of two or more hours, including the time segment when traffic demands are highest and traffic operations are typically sub-standard. Land use adjacent to the project is considered as it may impact not only the time when data is collected, but also which study time period to use.
13.2.4 MOE Selection
As stated in
Chapter 4
of this manual, MOE provide information to decision makers on the performance of the microsimulation model and help determine similarities and differences between alternatives. These MOEs are projectand tool-specific but generally aim to quantify mobility, reliability, and accessibility. Modelers typically measure some or all of the following network MOEs while conducting a microsimulation analysis:- Control Delay (sec/veh);
- LOS (A-F) can be derived from control delay by converting all vehicles to passenger car equivalents per the HCM methodology. Otherwise, analysts can note that the LOS used is not equivalent to the HCM methodology.
- Results from the seeding period are typically excluded when reporting control delay.
- Queue Length (ft);
- Speed (mph);
- Includes average link speed and average route speed
- Travel Time (sec);
- Total Network Delay; and
- Density (passenger cars per hour per lane or pcphpl)
In addition to network MOEs, link MOEs are used if the results of specific roadway segments are of particular interest. MOEs for links include volume, density, speed, emissions, and relative delay. Add a caveat when reporting density directly from a microsimulation model since microsimulation tools have their own way of interpreting density while the HCM density is based on converting all vehicles to a passenger car equivalent. Network MOEs are also an output from some microsimulation models. These MOEs include environmental MOEs (total emissions released), total number of vehicles, average speed, total stops, average stops, fuel consumption, latent demand, total travel time, and total delay. These MOE types describe the results of the entire network rather than specific intersections or links. See
Chapter 4
for additional guidance on MOE selection.13.2.5 Analysis Tool Selection
Due to the complex and resource-intensive nature of microsimulation tools, carefully consider the tool based on project scope, project schedule, project type, needs, complexity, MOEs, and budget. There is often more than one suitable traffic analysis tool for a given project. Only use microsimulation when necessary.
Microsimulation is often used to analyze locations with the following characteristics:
- oversaturated conditions (traffic volumes over capacity);
- corridors with multiple hours of congestion;
- multilane or two-lane rural roads where traffic signals or stop signs considerably impact capacity and/or operations;
- freeway widening projects;
- access management studies;
- climbing lanes for trucks;
- short through-lane is added or dropped at a signal;
- roundabouts of more than a single lane;
- tight diamond interchanges;
- multimodal operations (transit, pedestrian, bike, freight); and
- atypical conditions