Section 5: Lonestar Data in Cluster Analysis Case Study
TxDOT Fort Worth District – Use of Lonestar Advanced Traffic Management System (ATMS) Data in a cluster analysis.
The Fort Worth District has many microwave traffic detectors set up around Tarrant County freeways. Traffic count data can be collected from these detectors and is available for historical counts and microsimulation model development.
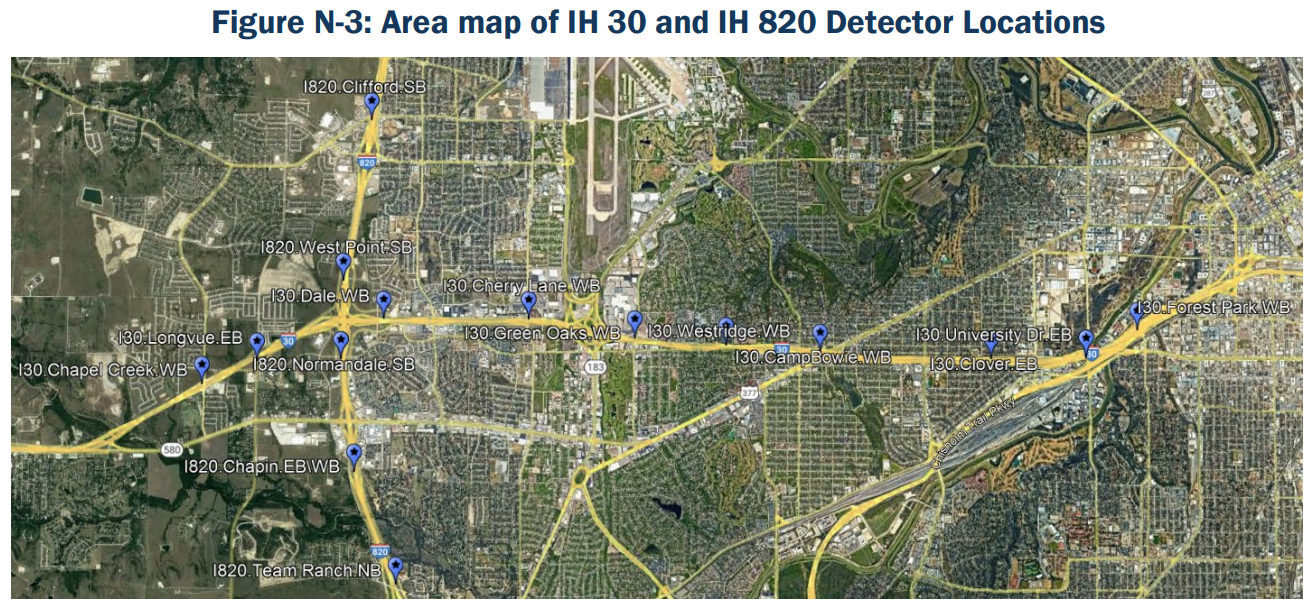
The I-30 (I-820 to Chisholm Trail Parkway) project team, with the assistance of TxDOT and TxDOT’s traffic and ITS group, utilized Lonestar data collection to support the simulation and calibration of a microsimulation model that represented the I-30 corridor in terms of standards of validation set by FHWA traffic analysis toolbox (2019). The ATMS data obtained from TxDOT is one input into the cluster analysis required by FHWA. The Project Team determined that there are fifteen traffic detectors in or near the IH 30 IAJR project area of influence (AOI). The location of the detectors along IH 30 and IH 820 are shown in
Equipment ID | Equipment Name | Latitude | Longitude | Protocol Name |
2233 | I30.Chapel Creek.WB | 32.72962 | -97.503918 | WavetronixHD |
2683 | I30.Longvue.EB | 32.73292 | -97.495420 | WavetronixHD |
972 | I30.Dale.WB | 32.73849 | -97.474918 | WavetronixHD |
968 | I30.Cherry Lane.WB | 32.73843 | -97.451535 | WavetronixHD |
976 | I30.Green Oaks.WB | 32.73583 | -97.434442 | WavetronixHD |
982 | I30.Westridge.WB | 32.73460 | -97.418555 | WavetronixHD |
1802 | I30.CampBowie.WB | 32.73402 | -97.404607 | WavetronixHD |
970 | I30.Clover.EB | 32.73278 | -97.377106 | WavetronixHD |
981 | I30.University Dr.EB | 32.73325 | -97.361801 | WavetronixHD |
975 | I30.Forest Park.WB | 32.73805 | -97.353355 | WavetronixHD |
1018 | I820.Clifford.SB | 32.76557 | -97.477134 | WavetronixHD |
1035 | I820.West Point.SB | 32.74366 | -97.481464 | WavetronixHD |
1025 | I820.Normandale.SB | 32.73298 | -97.481751 | WavetronixHD |
1017 | I820.Chapin.EB\WB | 32.71870 | -97.479800 | WavetronixHD |
1031 | I820.Team Ranch.NB | 32.70262 | -97.472646 | WavetronixHD |
For each working detector, data is available as follows:
- Data is per poll cycle. This is configurable per detector. Most detectors are set to either 20 or 30 seconds.
- Speed is available per lane. It is the average speed per lane during the poll cycle based on that point on the roadway.
- Volume is available per lane. It is the actual count per lane during the poll cycle of vehicles crossing the detector.
- Occupancy is available per lane. It is the average occupancy per lane during the poll cycle at the detector.
For this IH 30 study the project team requested the data for hourly counts for the entire year of 2022. The raw count data was consolidated by TRF Division staff/contractors, and it was placed into six csv files on Box.com (TxDOT’s official file transfer method) for downloading by the project team. Each csv file covered about two months of data for all fifteen locations, and the files were about 2 megabits each in size. A Google image of the IH 30 and IH 820 corridors and the fifteen detector locations are shown in .
Data Returned (.xlsx format):
- Timestamp
- Hour (1-hour bin data)
- Detector Name with directionality
- Lane assignment
- Requested Data (Volumes and/or Speed)
Volume (ATMS) Data
obtained from TxDOT, the project team selected one location that coincided with a known bottleneck and summarized the per lane volume data directionally. This volume data is combined with other data sets (precipitation, crash data, and travel time data) in a cluster analysis that normalizes all data sets in representative and non-representative clusters.Precipitation Data
was collected from the Automated Surface Observing System (ASOS) program. The modeling included precipitation data from (NFW) Fort Worth NAS weather station of Texas ASOS Network. The precipitation variable in the modeling was considered as the accumulative precipitation levels in inches during the peak period (whether it is AM or PM), on a given day.Crash Data
for the area of influence was acquired from TxDOT’s Traffic Safety Division, ranging from year 2018 through 2022, to conduct a historical crash statistic summary. Data from year 2022 was utilized within the cluster analysis.Speed Data
from January 1 to December 31, 2022, was obtained from the NPMRDS for the I-30 mainlane project limits. Speed data is divided into TMC segments that represent sections of the project corridor. This segmentation ensures that clustering can make note of any outlier sections and days that may impact the clustering results.Data Normalization
The volume, speed, and precipitation data are normalized using a scale between 0 and 1. A linear scale, as presented in FHWA TAT III guidelines, is used for the normalization. See the following equation: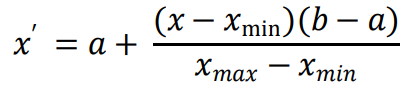
x’= normalized value of data
x = minimum value for the attribute (min over all x)
min
x = maximum value for the attribute (max over all x)
max
a
= minimum value of common scale (e.g., 1 if normalizing to scale of 0 to 1)b
= maximum value of common scale (e.g., 1 if normalizing to scale of 0 to 1)After the data has been normalized, it is reviewed for redundancy and attributes that have no impact on the cluster analysis. From the review, it was observed that the precipitation data would not be a controlling data set and was removed from the cluster analysis. Based on the results of the cluster analysis and identifying the data points in the representative cluster, a single day that is closest to the mean is selected as the representative day. The data (volume and travel time) associated with the representative day and standard deviation of the remaining days in the representative cluster is used to define the 1-sigma, 2-sigma envelopes, along with the BDAE tolerances for model validation.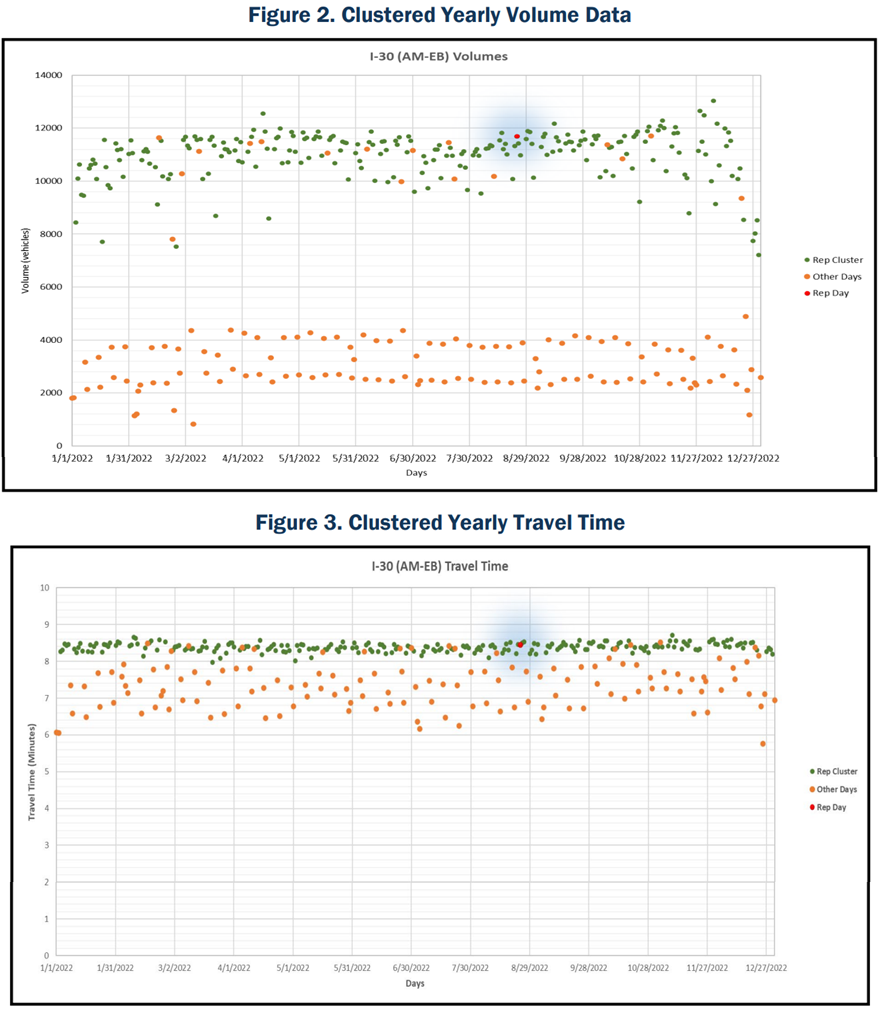
Conclusions
The project team found that the volume data for the entire year of 2022 allowed for confirmation that the traffic volume on the corridor is minimally impacted throughout the year (school vs no school, any times with heavy recreational use), and it shows as expected, commuting days (Monday through Friday) vs weekend volume is noticeably different.
The project team found that requesting, downloading, and processing the data was easily managed, and there were no issues with downloading the six data files through Box.com and processing them for use in the clustering analysis.