Roadway Overtopping
Where water flows both over the roadway and through a culvert (see Figure 8‑17), a flow distribution analysis is required to define the hydraulic characteristics. This is a common occurrence where a discharge of low design AEP (low probability of occurrence) is applied to a facility designed for a lower design frequency.
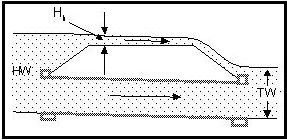
Figure 8-17. Culvert with Overtopping Flow
For example, a complete design involves the application and analysis of a 1% AEP discharge to a hydraulic facility designed for a much smaller flood. In such a case, the headwater may exceed the low elevation of the roadway, causing part of the water to flow over the roadway embankment while the remainder flows through the structure. The headwater components of flow form a common headwater level. An iterative process is used to establish this common headwater.
The following procedure is an iterative approach that is reasonable for hand computations and computer programs:
- Initially assume that all the runoff (analysis discharge) passes through the culvert, and determine the headwater. Use the procedures outlined in the section. If the headwater is lower than the low roadway elevation, no roadway overtopping occurs and the analysis is complete. Otherwise, proceed to step 2.
- Record the analysis discharge as the initial upper flow limit and zero as the initial lower flow limit. Assign 50% of the analysis discharge to the culvert and the remaining 50% to the roadway as the initial apportionment of flow.
- Using the procedures outlined in the section, determine the headwater with the apportioned culvert flow.
- Compute the roadway overflow (discharge) required to subtend the headwater level determined in step 3 using Equation 8-28.
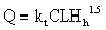 Equation 8-28.where:
- Q= discharge (cfs or m3/s)
- kt= over-embankment flow adjustment factor (see Figure 8‑18)
- C= discharge coefficient (use 3.0 – English or 1.66 metric for roadway overtopping)
- L= horizontal length of overflow (ft. or m). This length should be perpendicular to the overflow direction. For example, if the roadway curves, the length should be measured along the curve.
- Hh= average depth between headwater and low roadway elevation (ft. or m).
- Base the value Hhon the assumption that the effective approach velocity is negligible. For estimation of maximum headwater, this is a conservative assumption. However, under some conditions, such as the need to provide adequate detention storage, you may need to consider the approach velocity head (v2/2g). That is, replace Hhin Equation 8-28 with Hh+ v2/2g.
- With reference to Figure 8‑19, the flow over the embankment will not be affected by tailwater if the excess (Ht) is lower than critical depth of flow over the road (approximately 0.67 Hh) . For practical purposes, Ht/Hhmay approach 0.8 without any correction coefficient. For Ht/Hhvalues above 0.8 use Figure 8‑18 to determine kt.
- For most cases of flow over highway embankments, the section over which the discharge must flow is parabolic or otherwise irregular (see Figure 8‑20). In such cases, it becomes necessary to divide the section into manageable increments and to calculate individual weir flows for the incremental units, summing them for total flow.
- If the tailwater is sufficiently high, it may affect the flow over the embankment. In fact, at high depth, the flow over the road may become open channel flow, and weir calculations are no longer valid. At extremely high depth of roadway overtopping, it may be reasonable to ignore the culvert opening and compute the water surface elevation based on open channel flow over the road.
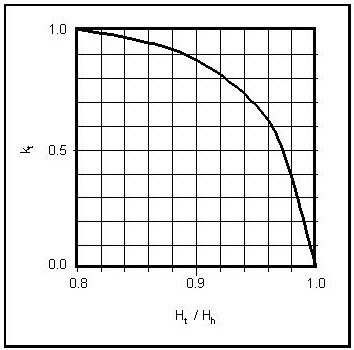 Figure 8-18. Over Embankment Flow Adjustment Factor
 Figure 8-19. Roadway Overtopping with High Tailwater
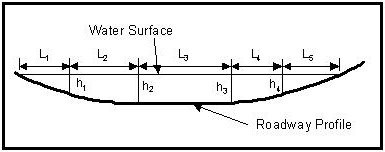 Figure 8-20. Cross Section of Flow over Embankment
 - Add the calculated roadway overflow to the culvert flow. If the calculated total is greater than the analysis discharge, record the current culvert flow apportionment as the current upper flow limit and set the new culvert flow apportionment at a value halfway between the current upper and lower flow limits. If the calculated total is less than the analysis discharge, record the current culvert flow apportionment as the lower flow limit for the culvert and set the new culvert flow apportionment at a value halfway between the current upper and lower flow limits.
- Repeat steps 3 to 5, using the culvert flow apportionment established in step 5, until the difference between the current headwater and the previous headwater is less than a reasonable tolerance. For computer programs, the department recommends a tolerance of about 0.1 in. The current headwater and current assigned culvert flow and calculated roadway overflow can then be considered as the final values.