Performance Curves
For any given culvert, the control (outlet or inlet) might vary with the discharge. Figure 8‑18 shows sample plots of headwater versus discharge for inlet and outlet control. The envelope (shown as the bold line) represents the highest value of inlet and outlet headwater for any discharge in the range. This envelope is termed a performance curve.
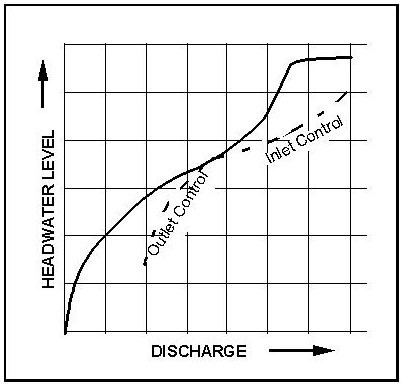
Figure 8-21. Typical Performance Curve
In this example, inlet control prevails at lower discharges and flow transitions to outlet control as the discharge increases. The flatter portion represents the effect of roadway overflow. The performance curve can be generated by calculating the culvert headwater for increasing values of discharge. Such information is particularly useful for performing risk assessments and for hydrograph routing through detention ponds and reservoirs.