Texas Storm Hyetograph Development Procedure
Texas specific dimensionless hyetographs were developed by researchers at
,
,
, and
(Williams-Sether et al. 2004, Asquith et al. 2005). Two databases were used to estimate the hyetographs: 1) rainfall recorded for more than 1,600 storms over mostly small watersheds as part of historical USGS studies, and 2) hourly rainfall data collection network from the NWS over eastern New Mexico, Oklahoma, and Texas.
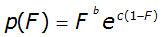
Three methods of developing dimensionless hyetographs are presented: 1) triangular dimensionless hyetograph; 2) L-gamma dimensionless hyetograph; and 3) empirical dimensionless hyetograph. Any of these hyetographs can be used for TxDOT design. Brief descriptions of the three methods are presented here. For further information and example problems on the Texas hyetographs, refer to Asquith et al. 2005.
Triangular Dimensionless Hyetograph
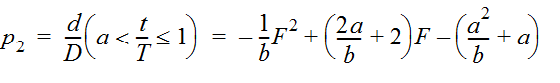
A triangular dimensionless hyetograph is presented in Figure 4-17. The vertical axis represents relative rainfall intensity. The rainfall intensity increases linearly until the time of peak intensity, then decreases linearly until the end of the storm. The triangular hyetograph, in terms of relative cumulative storm depth, is defined by Equations 4-26 and 4-27, with values for parameters a and b provided in Table 4-13.
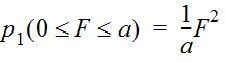
Equation 4-26.
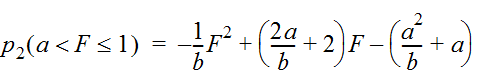
Equation 4-27.
Where:
- p= normalized cumulative rainfall depth, (ranging from 0 to 1) for F ranging from 0 to a1
- p2= normalized cumulative rainfall depth, (ranging from 0 to 1) for F ranging from a to 1
- F= elapsed time, relative to storm duration, ranging from 0 to 1
- a= relative storm duration prior to peak intensity, from Table 4-13
- b= relative storm duration prior to peak intensity, from Table 4-13
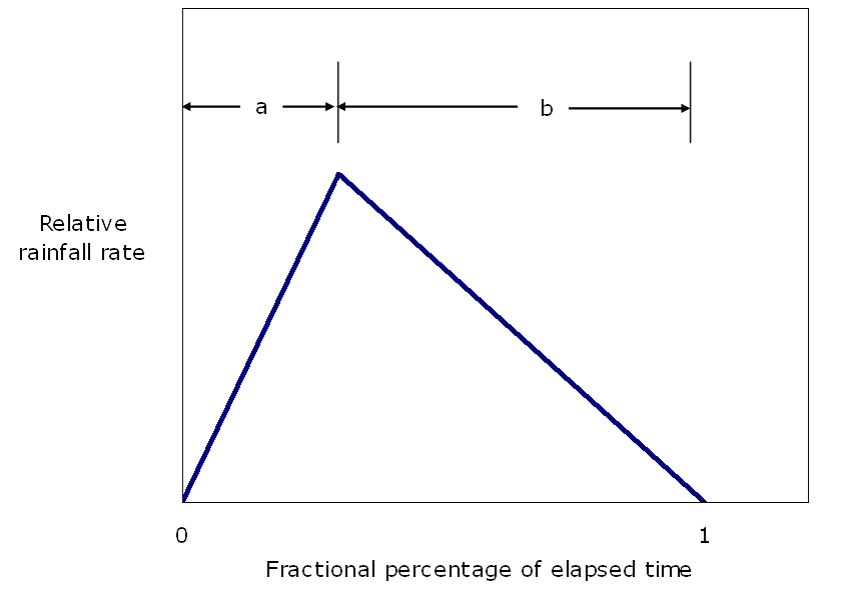
Figure 4-17. Triangular dimensionless Texas hyetograph
Triangular hyetograph model parameters | Storm duration | ||
|---|---|---|---|
5-12 hours | 13-24 hours | 25-72 hours | |
a | 0.02197 | 0.28936 | 0.38959 |
b | 0.97803 | 0.71064 | 0.61041 |
Based on the storm duration, the designer selects the appropriate parameters a and b for use in Equations 4-26 and 4-27. The ordinates of cumulative storm depth, normalized to total storm depth, are thus obtained. Values of rainfall intensity are obtained by computing total storm depth for durations of interest, and dividing by the duration.
Triangular Dimensionless Hyetograph Procedure
The following is an example computation using the triangular dimensionless hyetograph procedure for a 12-hour storm with cumulative depth of 8 inches:
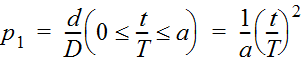
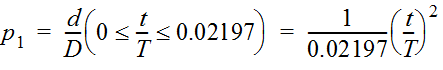
- Express F in Equations 4-26 and 4-27 in terms of time t and total storm duration T: F = t / T.
- Express p in terms of cumulative rainfall depth d and total storm depth D: p = d / D.
- Substituting into Equations 4-26 and 4-27 gives:
- From Table 4-13, a = 0.02197 and b = 0.97803.

- Substituting 12 (hours) for T and 8 (inches) for D gives:
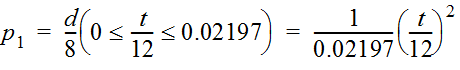

- Simplifying:
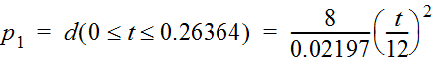

These resulting equations provide cumulative depth in inches as a function of elapsed time in hours, as shown in Table 4-14.
Time, t (hr.) | Precipitation Depth, d (in.) | Precipitation Intensity, I (in./hr.) |
|---|---|---|
0 | 0 | 0 |
0.13 | 0.04 | 0.33 |
0.26 | 0.17 | 0.99 |
0.50 | 0.49 | 1.32 |
0.75 | 0.81 | 1.29 |
1.00 | 1.13 | 1.26 |
2.00 | 2.32 | 1.19 |
3.00 | 3.40 | 1.08 |
4.00 | 4.36 | 0.97 |
5.00 | 5.22 | 0.85 |
6.00 | 5.96 | 0.74 |
7.00 | 6.58 | 0.62 |
8.00 | 7.09 | 0.51 |
9.00 | 7.49 | 0.40 |
10.00 | 7.77 | 0.28 |
11.00 | 7.94 | 0.17 |
12.00 | 8.00 | 0.06 |
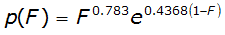
L-gamma Dimensionless Hyetograph
Asquith (2003) and Asquith et al. (2005) computed sample L-moments of 1,659 dimensionless hyetographs for runoff-producing storms. Storms were divided by duration into 3 categories, 0 to 12 hours, 12 to 24 hours, and 24 to 72 hours. Dimensionless hyetographs based on the L-gamma distribution were developed and are defined by:
Equation 4-28.
Where:
- e= 2.718282
- p= normalized cumulative rainfall depth, ranging from 0 to 1
- F= elapsed time, relative to storm duration, ranging from 0 to 1
- b= distribution parameter from Table 4-15
- c= distribution parameter from Table 4-15
Parameters b and c of the L-gamma distribution for the corresponding storm durations are shown in Table 4-15. Until specific guidance is developed for selecting parameters for storms of exactly 12 hours and 24 hours, the designer should adopt distribution parameters for the duration range resulting in the more severe runoff condition.
Storm duration | L-gamma distribution parameters | |
|---|---|---|
b | c | |
0 – 12 hours | 1.262 | 1.227 |
12 – 24 hours | 0.783 | 0.4368 |
24 - 72 hours | 0.3388 | -0.8152 |
L-gamma Dimensionless Hyetograph Procedure
Use the following steps to develop an L-gamma dimensionless Texas hyetograph for storm duration of 24 hours and a storm depth of 15 inches:
- Enter the L-gamma distribution parameters for the selected storm duration into the following equation:
- Express F in terms of time t and total storm duration T: F = t / T. Express p in terms of cumulative rainfall depth d and total storm depth D: p = d / D. Substituting gives:
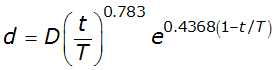
- Substitute 24 (hours) for T and 15 (inches) for D:
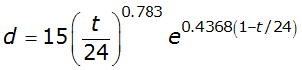
This equation defines the storm hyetograph. d is the cumulative depth in inches, and t is the elapsed time in hours.
Empirical Dimensionless Hyetograph
Empirical dimensionless hyetographs (Williams-Sether et al. 2004, Asquith et al. 2005) have been developed for application to small drainage areas (less than approximately 160 square miles) in urban and rural areas in Texas. The cumulative hyetographs are dimensionless in both duration and depth, and are applicable for storm durations ranging from 0 to 72 hours. The hyetograph shapes are not given by a mathematical expression but are provided graphically for 1
st
, 2nd
, 3rd
, and 4th
quartile storms as well as for a combined (1st
through 4th
quartile) storm.To use the hyetographs, the designer determines the appropriate storm depth and duration for the annual exceedance probability (AEP) of interest. The quartile defines in which temporal quarter of the storm the majority of the precipitation occurs – the graphs for individual quartiles as well as corresponding tabulations are available in
.
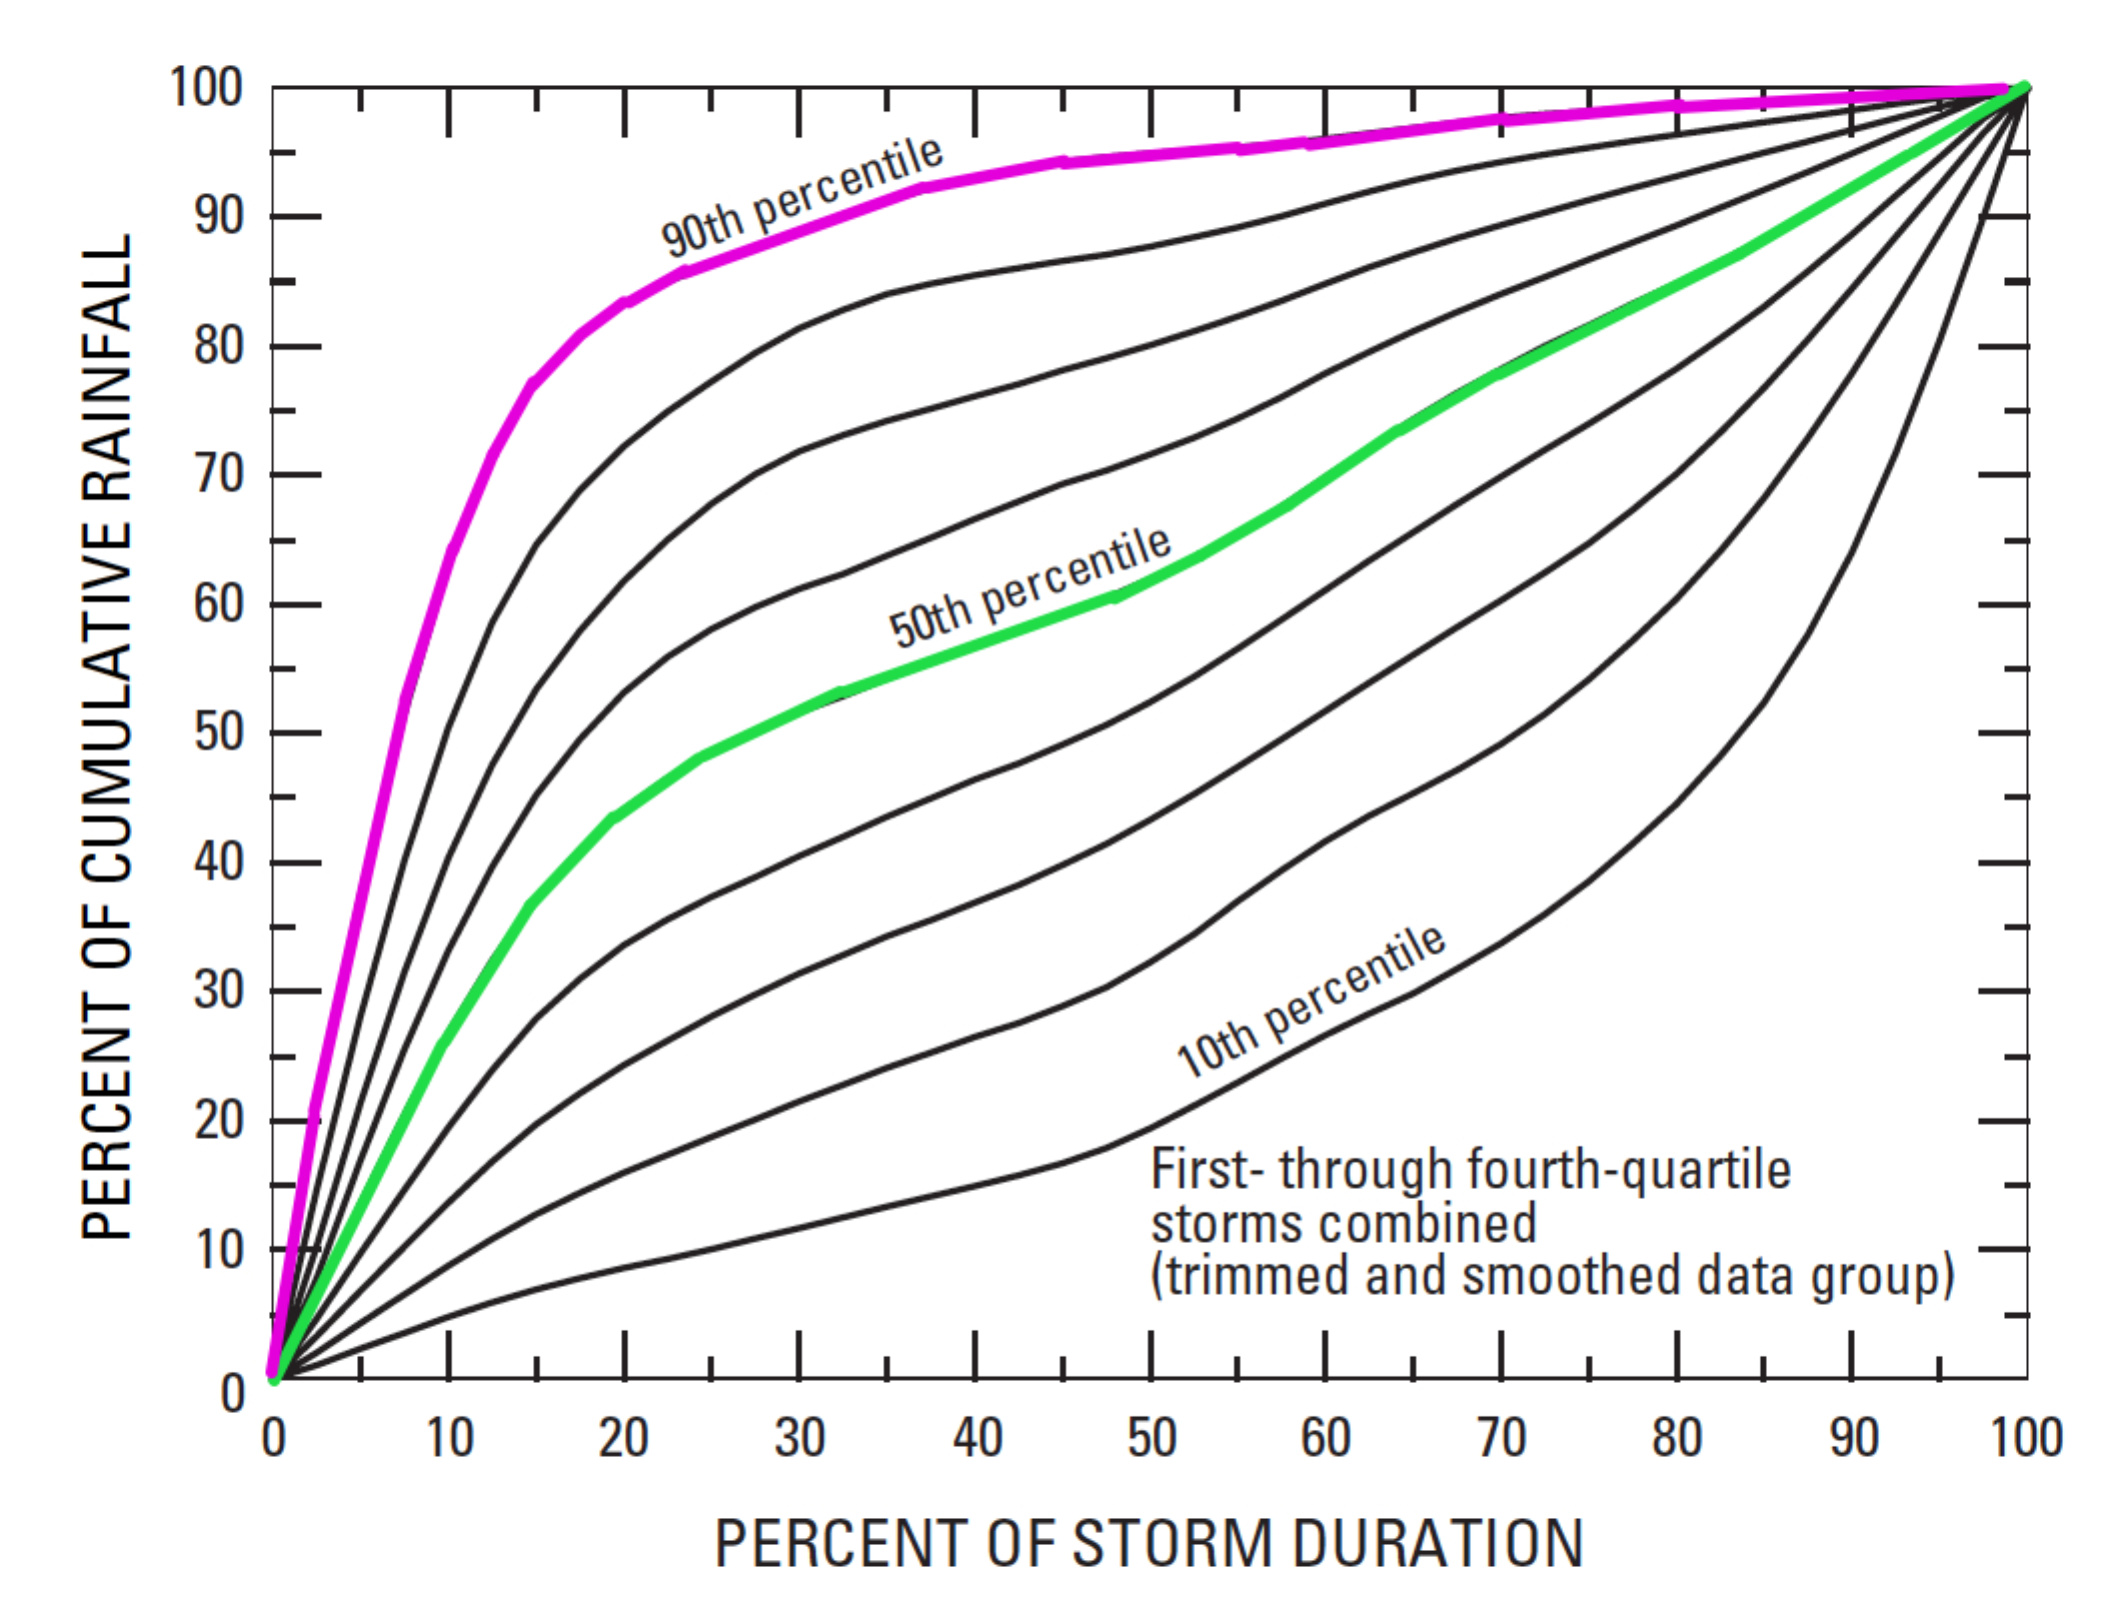
Figure 4-18. Dimensionless hyetographs for 0 to 72 hours storm duration (from Williams-Sether et al. 2004)
Storm duration (%) | 50 th Percentile Depth (%) | 90 th Percentile Depth (%) |
|---|---|---|
0.00 | 0.00 | 0.00 |
2.50 | 8.70 | 21.60 |
5.00 | 13.58 | 37.57 |
7.50 | 20.49 | 51.55 |
10.0 | 26.83 | 63.04 |
12.5 | 32.42 | 71.66 |
15.0 | 37.21 | 77.38 |
17.5 | 41.00 | 80.89 |
20.0 | 44.11 | 83.32 |
22.5 | 46.55 | 85.01 |
25.0 | 48.54 | 86.35 |
27.5 | 50.23 | 87.66 |
30.0 | 51.68 | 88.96 |
32.5 | 52.9 | 90.18 |
35.0 | 54.27 | 91.29 |
37.5 | 55.49 | 92.25 |
40.0 | 56.80 | 93.05 |
42.5 | 58.03 | 93.72 |
45.0 | 59.31 | 94.24 |
47.5 | 60.49 | 94.64 |
50.0 | 61.97 | 94.92 |
52.5 | 63.51 | 95.18 |
55.0 | 65.39 | 95.40 |
57.5 | 67.56 | 95.70 |
60.0 | 69.85 | 96.06 |
62.5 | 72.11 | 96.47 |
65.0 | 74.32 | 96.9 |
67.5 | 76.38 | 97.32 |
70.0 | 78.21 | 97.68 |
72.5 | 80.00 | 97.97 |
75.0 | 81.61 | 98.19 |
77.5 | 83.25 | 98.38 |
80.0 | 84.84 | 98.56 |
82.5 | 86.54 | 98.72 |
85.0 | 88.30 | 98.90 |
87.5 | 90.21 | 99.09 |
90.0 | 92.18 | 99.29 |
92.5 | 94.22 | 99.49 |
95.0 | 96.21 | 99.70 |
97.5 | 98.21 | 99.92 |
100.0 | 100.00 | 100.00 |
Figure 4-18 is a graphical representation of the combined storm with the 50th percentile (green) and 90th percentile (magenta) storm hyetograph highlighted, and Table 4-17 is the corresponding tabulation for a 50th percentile (median) storm and a 90th percentile storm. The recommended 50th percentile curve represents a median combined (1
st
through 4th
quartile) storm. The 90th percentile curve represents an upper support combined (1st
through 4th
quartile) storm where 90 percent of hyetographs would be anticipated to track either on or below the curve.Confidence limits for the empirical dimensionless hydrographs have been computed for each of the four quartile hyetographs and are reported in
. Because the hyetographs are dimensionless, all of the percentile hyetographs have the same dimensionless storm depth but represent variations in the temporal distribution of rainfall during the storm duration.
A spreadsheet tool,
(developed by
) is available to facilitate the use of the dimensionless hyetograph. It will assist the designer in producing elapsed time in minutes (or hours) and cumulative depth in inches (or millimeters) for the 50th or 90th percentile hyetograph. A
for use of the tool is included in
. The tool can also be used in conjunction with the
spread sheet.