Design Storm Development
A design storm is a precipitation pattern or intensity value defined for design of drainage facilities. Design storms are either based on historical precipitation data or rainfall characteristics in the project area or region. Application of design storms ranges from point precipitation for calculation of peak flows using the rational method to storm hyetographs as input for rainfall-runoff analysis in the hydrograph method. The fundamental assumption using design storms is that precipitation of an
yields runoff of the same AEP.
Selection of Storm Duration
Selecting storm duration is the first step in design storm modeling. The appropriate storm duration for stormwater runoff calculations is dependent on the drainage area’s hydrologic response. The selected storm duration should be sufficiently long that the entire drainage area contributes to discharge at the point of interest. Storm duration is defined in terms of time of concentration (t
c
), which is the time it takes for runoff to travel from the hydraulically most distant point of the watershed to a point of interest within the watershed.For complete drainage of the area, time for overland flow, channel flow, and storage must be considered. Typically for hydrograph computations the storm duration should be four or five times the
. Longer duration of storm will not increase the peak discharge substantially, but will contribute greater volume of runoff.
Commonly, a storm duration of 24 hours is used. However the 24-hour storm duration should not be used blindly. Runoff from longer and shorter storms should be computed to demonstrate the sensitivity of the design choices.
For TxDOT, the 24-hour storm should be used as a starting point for analysis. However, if the analysis results appear inconsistent with expectations, site performance, or experience, an alternative storm duration should be considered. In that case, the designer should consult the Design Division Hydraulics Branch for advice.
Storm Depth: Depth-Duration-Frequency (DDF) Relationships
Once the storm duration is selected, the next step is to determine the rainfall depth or intensity of that duration for the selected AEP.
Depth-Duration-Frequency (DDF) data at each project location is available from the 2018 NOAA Atlas 14 data and accessible through NOAA's Precipitation Frequency Data Server (
). The PFDS is a point-and-click interface developed to deliver NOAA Atlas 14 precipitation frequency estimates and associated information. The PFDS values have been developed on a 300m grid system. For larger watersheds, engineers will need to use judgment in selecting a reasonable point to establish depth values. Consideration should be taken with respect to varying depths across the watershed. The location of the selected depth values and a brief explanation should be reported in the drainage report or plans. Estimates and their confidence intervals can be displayed directly as tables or graphs. From drop-down options on the website, appropriate data type (depth or intensity) and timeseries type (partial duration or annual maximum) should be selected prior to selecting the location. Annual maximum should be selected as the time series for most analyses. Certain municipalities may have a stated preference for use of partial duration and if so, to minimize model differences, that time series type may be used.
The AEPs represented are 1/2, 1/5, 1/10, 1/25, 1/50, 1/100, 1/200, 1/500, 1/1000 (2-, 5-, 10-, 25-, 50-, 100-, 200-, 500-, and 1000- years). The storm durations represented are 5, 10, 15,30 and 60 minutes; 2, 3, 6, and 12 hours; and 1, 2, 3, 4, 7, 10, 20, 30, 45 and 60 days. The depth or intensity for the strom with an Average Recurrence Interval (ARI) of one year is provided with partial duration series.
The prior data source for rainfall was the
(TxDOT 5-1301-01-1, 2004). This was an extension of a 1998 USGS
study and an update of
(Hershfield 1961),
(Miller 1964), and
(Frederick et al. 1977). All these prior precipitation reports are considered superseded for Texas with the 2018 NOAA Atlas 14 data.
Intensity-Duration-Frequency Relationships
While hydrograph methods require both rainfall depth and temporal distribution, the rational method requires only intensity. The rainfall intensity (I) is the average rainfall rate in inches/hour for a specific rainfall duration and a selected frequency. For drainage areas in Texas, rainfall intensity may be computed by:
- UsingDepth-Duration-Frequency (DDF) tabular data/graphs for Texas from the NOAA Precipitation Frequency Data Server ( )to obtain the precipitation depth for a given frequency.
- Converting the precipitation depth to a precipitation intensity by dividing the depth by the storm duration. The precipitationintensityis measured in inches/hour.
For example, if the 100-year, 6-hour depth is 3.2 inches, the
average
precipitation intensity over those 6 hours
equals 3.2 inches/6 hours = 0.53 inches/hour. However, the IDF relationships are available from the PFDS server and may be obtained directly without performing this conversion.
Areal Depth Adjustment
When estimating runoff due to a rainfall event, a uniform areal distribution of rainfall over the watershed is assumed. However, for intense storms, uniform rainfall is unlikely. Rather, rainfall varies across the drainage area. To account for this variation, an areal adjustment is made to convert point depths to an average areal depth. For drainage areas smaller than 10 square miles, the areal adjustment is negligible. For larger areas, point rainfall depths and intensities must be adjusted. Two methods are presented here for use in design of drainage facilities: the first is by the US Weather Bureau and the second is by
.
US Weather Bureau Areal Depth Adjustment
The US Weather Bureau (1958) developed Figure 4-11 from an annual series of rain gauge networks. It shows the percentage of point depths that should be used to yield average areal depths.
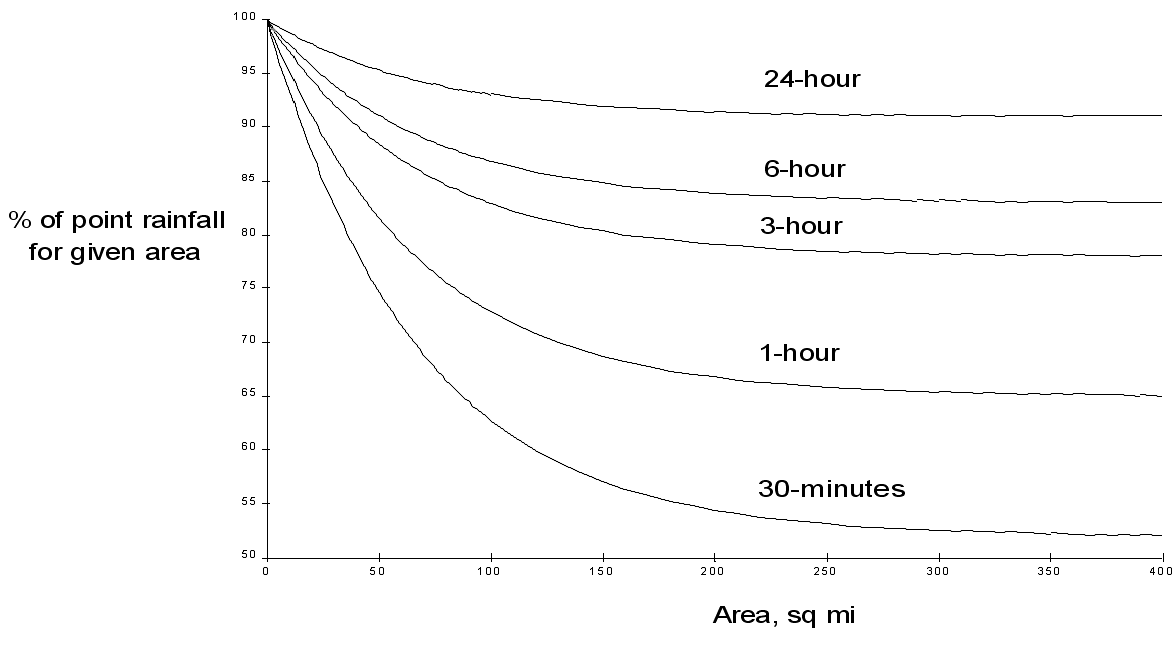
Figure 4-12. Depth area adjustment (US Weather Bureau 1958)
USGS Areal-Reduction Factors for the Precipitation of the 1-Day Design Storm in Texas
Areal reduction factors (ARFs) specific for Texas for a 1-day design storm were developed by Asquith (1999). Asquith’s method uses an areal reduction factor that ranges from 0 to 1. The method is a function of watershed characteristics such as size and shape, geographic location, and time of year that the design storm is presumed to occur. The study was based on precipitation monitoring networks in the Austin, Dallas, and Houston areas. If using a 1-day design storm, this is the appropriate method of areal reduction to use for design of highway drainage facilities in Texas.
However, the applicability of this method diminishes the farther away from the Austin, Dallas, or Houston areas the study area is and as the duration of the design storm increasingly differs from that of 1 day. For further information and example problems on calculating the ARF, refer to Asquith (1999).
A relationship exists between the point of an annual precipitation maxima and the distance between both the centroid of the watershed and every location radiating out from the centroid. This is assuming the watershed is nearly circular. ST(r) is the expected value of the ratio between the depth at some location a distance r from the point of the design storm. T refers to the frequency of the design storm. Equations for ST(r) for the 50% (2-year) or smaller AEP vary by proximity to Austin, Dallas, and Houston. For an approximately circular watershed, the ARF is calculated with the following equation:
Equation 4-24.
Where:
r = variable of integration ranging from 0 to R
- R= radius of the watershed (mi)
- S= estimated 2-year or greater depth-distance relation (mi)2(r)
The site-specific equations for S
2
(r) for differing watershed radii are in Table 4-12 at the end of this section.Once the ARF is calculated, the effective depth of the design storm is found by multiplying the ARF by the point precipitation depth found using
.
For example, an approximately circular watershed in the Dallas area is 50.3 square miles (R = 4 miles). From Table 4-12:
S
2
= 1.0000 – 0.06(r) for 0 ≤ 𝑟
≤ 2 S
2
= 0.9670 – 0.0435(r) for 2 ≤ 𝑟
≤ 4 Substituting the above expressions into Equation 4-24 gives:
ARF = 0.85
An easier way to determine ARF for circular watersheds is to use the equation from Table 4-12 in column “ARF for circular watersheds having radius r” for the city and radius of interest. For the previous example (City of Dallas, R = 4 miles), the equation would be:
ARF = 0.9670-0.0290(r) + (0.0440/r
2
)ARF = 0.85
From
NOAA's Precipitation Frequency Data Server
, the 1% (100-year) 1-day depth is 9.55
inches. Multiply this depth by 0.85 to obtain the 24-hour 1%
areally reduced storm depth of 8.12
inches.If the designer finds that a circular approximation of the watershed is inappropriate for the watershed of interest, the following procedure for non-circular watersheds should be used. The procedure for non-circular watersheds is as follows:
- Represent the watershed as discrete cells; the cells do not have to be the same area.
- Locate the cell containing the centroid of the watershed.
- For each cell, calculate the distance to the centroid (r).
- Using the distances from Step 3, solve the appropriate equations from for S2(r) for each cell.
- Multiply S2(r) by the corresponding cell area to compute ARF; the area multiplication simply acts as a weight for a weighted mean.
- Compute the sum of the cell areas.
- Compute the sum of the product of S2(r) and cell area from Step 5.
- Divide the result of Step 7 by Step 6.
City | Estimated 2-yr or greater depth-distance relation for distance r (mi) | ARF for circular watersheds having radius r (mi) | Equation limits |
|---|---|---|---|
Austin |  |  |  |
 |  |  | |
 |  |  | |
 |  |  | |
 |  |  | |
 |  |  | |
 |  |  | |
 |  |  | |
 |  |  | |
 |  |  | |
 |  |  | |
Dallas |  |  |  |
 |  |  | |
 |  |  | |
 |  |  | |
 |  |  | |
 |  |  | |
 |  |  | |
 |  |  | |
 |  |  | |
 |  |  | |
 |  |  | |
Houston |  |  |  |
 |  |  | |
 |  |  | |
 |  |  | |
 |  |  | |
 |  |  | |
 |  |  | |
 |  |  |