Data Analysis and Interpretation
Analysis means to divide a whole into its parts in order to discover the nature, function, and relationship of those parts.
Data subgroups should be reviewed to determine over-representation. Such over-represented subgroups indicate highway safety problems. A good example of this would be the high percentage of teenage drivers involved in crashes versus the much lower percentage among all drivers.
Further analysis should focus on subgroup characteristics. For example, increased severity, or any other factors available from the data.
Over-represented factors can be determined by comparing the rate of crashes for a subgroup or characteristic within the jurisdiction to the same rate in a comparable or larger jurisdiction. The rate may be expressed either as a percentage or a ratio.
Percentage Example:
If the percentage of adult vehicle occupants that do not
use safety belts within a jurisdiction is greater than the statewide percentage, then that characteristic is over-represented.Ratio Example:
Dividing nighttime (10 P.M. to 6 A.M.) crashes by the total number of crashes for the jurisdiction within a given time frame produces a ratio, as follows: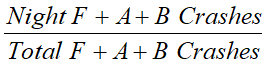
Where test:
- F= fatality crashes.
- A= incapacitating injury crashes.
- B= non-incapacitating injury crashes.
- Night= 10 P.M. to 6 A.M.