GPS Method
The GPS Method is based on the field measurement of curve geometry. The geometric data are then used with a speed prediction model to compute the average speed of trucks. This speed then becomes the basis for establishing the advisory speed.
The procedure for implementing the GPS Method consists of three steps. During the first step, measurements are taken in the field while traveling along the curve. During the second step, the measurements are used to compute the advisory speed. During the last step, the recommended advisory speed is confirmed through a field trial run. Each of these steps is described in the remainder of this section.
To ensure reasonable accuracy in the model estimates using this method, the curve deflection angle should be 6 degrees or more. A curve with a smaller deflection angle will rarely justify curve warning signs or an advisory speed plaque.
Equipment.
The equipment used includes the following:- GPS receiver,
- electronic ball bank indicator (optional), and
- laptop computer.
The GPS receiver is used to estimate curve radius and deflection angle. The electronic ball bank indicator is optional, and is used to estimate superelevation rate. If an electronic ball-bank indicator is not used, then superelevation rate will need to be estimated using other means.
The computer is used to run the Texas Roadway Analysis and Measurement Software (TRAMS) program. This program is designed to monitor the GPS receiver and the electronic ball-bank indicator while the test vehicle is driven along the curve. After the curve is traversed, TRAMS calculates curve radius and superelevation rate from the data streams. Advisory speed and traffic control device selection guidelines can be determined using the radius and superelevation rate estimates with the Texas Curve Advisory Speed (TCAS) spreadsheet. The TRAMS software, TCAS spreadsheet, and a TRAMS Installation Manual are available from the Traffic Operations Division (TRF).
Installation.
The following activities must be completed the first timeTRAMS is installed on the computer. More details are provided in the TRAMS Installation Manual.- Install the driver for the GPS receiver.
- If the electronic ball-bank indicator is used, an adapter may be needed to convert the RS-232 connection into a USB connection. Install the driver for this adapter.
- Install TRAMS (a copy of TCAS will also be installed in the TRAMS file directory).
Equipment Setup.
The following activities must be completed prior to using the equipment to establish the advisory speed for one or more curves.Mount the GPS receiver and electronic ball-bank indicator (if used) on the dashboard in a fixed position. These devices should not be able to move during the test runs. Figures 5-3 abd 5-4 show the devices mounted on the dashboard and secured using adhesive tape.
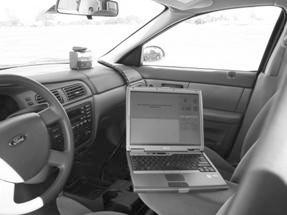
Figure 5-3. Equipment setup in test vehicle-laptop positioning.
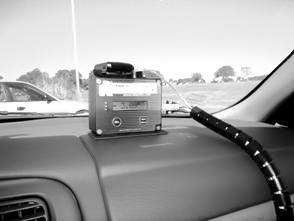
Figure 5-4. Equipment setup in test vehicle-GPS positioning.
If an electronic ball-bank indicator is used, activate its auto-leveling feature with the test vehicle parked on level pavement. Do this under the same vehicle loading and tire inflation conditions that will be present during the test runs.
With the laptop on, click on the TRAMS icon to launch TRAMS. TRAMS will initially connect with the two devices. It will then present the main panel, as shown in Figure 5-5.
Verify that TRAMS is receiving valid data from the GPS receiver. Information about the status of this device is located in the upper right corner of the main panel, as shown in Figure 5-5. A red circle indicates invalid (bad) data. A green circle indicates valid (good) data.
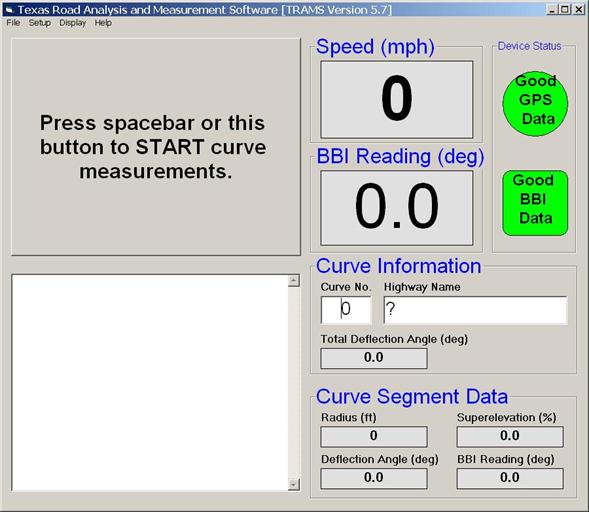
Figure 5-5. TRAMS main panel.
If the electronic ball-bank indicator (BBI) is used, verify that TRAMS is receiving valid data from it. A red square indicates invalid (bad) data. A green square indicates valid (good) data.
If valid data are not being received by one or both of the devices, check the following conditions:
- Are the devices turned on and properly connected to the laptop computer?
- Is the GPS receiver blocked from obtaining good satelite reception? Structures (bridges, garage roofs, buildings, etc.) or dense tree coverage may make it difficult to maintain GPS reception.
- Has TRAMS been configured with the proper port numbers for the devices? This can usually be accomplished by selecting the “Automatic” mode in the Configure Devices panel (from the main panel, select File, Configuration Settings, Configure Devices). If used, the electronic ball-bank indicator (“Reiker Device”) must also be enabled in this panel (i.e., select Enabled in the Rieker box).
- If any settings are changed in the Configure Devices panel, the Save Configuration File option should be selected to save all settings to the file (in which case they will be loaded and used each time TRAMS is launched).
Step 1. Field Measurements.
Before beginning a test run, enter the curve number and highway name in their respective fields provided on the main panel (see Figure 5-5).Repeat the measurements for the opposing direction of travel if the road is divided or if conditions suggest the need for separate consideration of each curve travel direction. When two or more curves are separated by a tangent of 600 ft. or less, one sign should apply for all curves. However, each curve should be surveyed separately in this step.
Speed Limit.
If the 85th percentile tangent speed is not known, note the regulatory speed limit on the roadway where the curve is located. The speed limit can subsequently be used in TCAS to estimate the 85th percentile tangent speed.Test Run Speed.
The following rules-of-thumb should be considered when selecting the test run speed.- The test run speed should be at least 10 mph below the existing curve advisory speed provided that the resulting test run speed is not less than 15 mph.
- If superelevation rate is being measured, test runs should be conducted at 45 mph or less, with slower speeds considered desirable in terms of yielding more accurate estimates of superelevation.
In general, a slower test run speed will improve accuracy in measurement by minimizing tire slip and allowing the driver to track the curve accurately.
Measurement Procedure.
The following task sequence describes the field measurement procedure as it would be used to evaluate one direction of travel through the subject curve. Measurement error and possible differences in superelevation rate between the two directions of travel typically justify repeating this procedure for the opposing direction. Only one test run should be required in each direction.- When the test vehicle is 1 or 2 seconds travel time in advance of the beginning of the curve, press the space bar or click the large button on the TRAMS main panel. This action will start the data collection process. Precise location of the beginning of the curve is not required. A reasonable estimate of its location, based on the analyst’s judgement, will suffice.
- While driving through the curve, track the centerline of the roadway as carefully as possible. This process will provide an accurate survey of the intended travel path. The analyst should avoid “cutting the corner” of sharp curves. The analyst should also avoid letting the vehicle drift to the outside of the lane while traveling along the curve.
- When the test vehicle is 1 or 2 seconds travel time beyond the end of the curve, press the space bar or click the large button a second time to stop recording curve data. Precise location of the end of the curve is not required. A reasonable estimate of its location, based on the analyst’s judgement, will suffice.
Save the File.
When asked whether a curve report file should be saved, indicate “Yes” by pressing Enter (or clicking on the Yes button). Alternatively, indicate “No” if it is believed that the curve was not accurately measured during the test run (e.g., the driver did not accurately track the curve, or the data recording was not started and stopped at the appropriate times). CAUTION: If the curve has the same number as a curve that was previously evaluated, the new file will overwrite the file from the previous curve.Optional Check When Superelevation Rate is Measured.
At the conclusion of the test run, the 95th percentile error range for superelevation rate is provided in the curve report file. It can be checked to confirm that the estimated value is reasonably precise. If this range exceeds 3 percent, repeat the test run at a lower speed. If the aforementioned test-run-speed rules-of-thumb were followed, then this check should not be needed.The curve report file can be accessed from the main panel by selecting File, Open Curve Report, and selecting the appropriate “log” file. The file will be named “Curve-XX-Rpt. Log,” where XX will be replaced by the curve number entered on the main panel before the start of the test run. Once the file is selected, select Open and the file will be opened in Notepad, a text editor provided with Windows®.
Step 2. Determine Advisory Speed.
Two options are available for determining the advisory speed. One option is based on a review of the survey data in the field. The second option is based on a review of the survey data in the office, following the survey of all curves of interest.When two or more curves are separated by a tangent of 600 ft. or less, one sign should apply for all curves. However, each curve should be evaluated separately in this step.The advisory speed plaque should show the value for the curve having the lowest advisory speed in the series.
Option 1: In-Field Determination.
This option is performed in the field. The data from the most recent test run is exported directly to TCAS. This action is accomplished from the main panel by selecting File, Export to TCAS. At this point, TCAS will load. The analyst will need to click on the “Import TRAM Data” button in TCAS to import the test run data into TCAS. This button is shown in the upper left corner of Figure 5-6. The analyst will also need to enter the 85th percentile speed in TCAS in the second to last row of the Input Data section. Alternatively, the analyst can enter the speed limit in the Alternate Input Data section and let TCAS compute an estimate of 85th percentile speed.As shown in Figure 5-6, TCAS allows the entry of data for up to six test runs, one column for each test run. The imported data are always placed in the same TCAS column (i.e., the left column). If the analyst wants to save any data in this column, then he or she should copy and paste the data to another column in TCAS (or another spreadsheet) and save the file. Exit TCAS (and Excel) after importing and evaluating the data for a given curve.
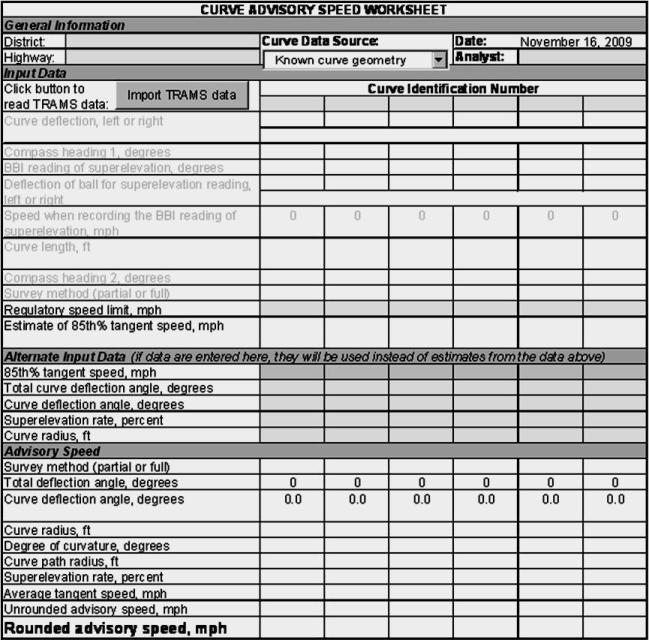
Figure 5-6. TCAS main panel.
Option 2: In Office Determination.
This option is performed back in the office. The curve report file for each curve is opened in Notepad and printed by selecting File, Print. There is one report for each unique curve number entered in TRAMS. The data on a report is typed into TCAS and the appropriate advisory speed determined. Instructions for opening a curve report file were provided in the previous step.Step 3: Confirm Speed for Conditions.
During this step, the appropriateness of the advisory speed determined in Step 2 is evaluated. The activities conducted during this step are the same as those discussed in Step 3 of the Direct Method, except that the need for an advisory speed plaque is checked using the information in the Traffic Control Device Guidance Section of TCAS.