Determining TVAR Percentage for Outside the Wheel Path
Once the design asphalt rate has been determined for the wheel paths of a given roadway, the next decision is whether the asphalt rate should be increased outside of the wheel paths and, if so, how much it should be increased.�
TVAR With Single Bar Distributors.
When the contractor is using a distributor with a single spray bar and only one TVAR increase is practical, the decision to be made is whether or not to vary the asphalt rate on a given pavement. TVAR is recommended in the specified 22 to 32 percent range whenever wheel path flushing is as evident as in the roadways shown in Figures 4-3 through 4-7. Otherwise, no variation in asphalt rate is usually the best choice.�TVAR With Dual Bar Distributors.
When the contractor has the capability of varying asphalt rates at percentages below the specified range, such as when using dual spray bar distributors, a broader and more optimal use of TVAR is possible. An asphalt rate increase between 10 and 15 percent is also recommended for roadways similar to the one shown in Figure 4-8. An asphalt rate increase of no more than 10 percent is recommended if TVAR is to be used on sections of roadway similar to Figure 4-9.�Dual spray bar distributors provide inspectors the flexibility to vary asphalt rates in small increments throughout their broad ranges of variation capability. Experienced inspectors are able to take advantage of this flexibility and prescribe small incremental changes in TVAR from one asphalt shot to the next based on small differences observed in the pavement being sealed. Seal coat contractors with a lot of TVAR experience can often provide good advice to be considered by the inspector. When neither the inspector nor the contractor has considerable experience in transversely varying the asphalt rate, it is suggested that the decision making be simplified to choosing between three options: no increase, 15 percent increase, and 30 percent increase. The decision between these three may be based on comparison of the roadway to be sealed to the roadways in Figures 4-3 through 4-9.�
Texture Testing When Uncertain About TVAR.
A simple and quick pavement surface test is available and should be used when there is any uncertainty about the TVAR difference to be selected. This is the sand patch test, which takes only minutes to run and is described in
.�Figures 4-10 and 4-11 show this test being performed on a pavement surface.�
On windy days, the test may be performed inside a wind shield as is being used in Figure 4-10. The diameter of the resulting “patch” will vary as pavement texture varies because the same volume of sand is always used. The greater the volume of void space created by the pavement’s texture, the smaller the patch diameter will be. The difference in patch diameters when the test is run in the wheel path and between the wheel paths gives a quick and revealing indication of the appropriate variation in the asphalt rate to use.�
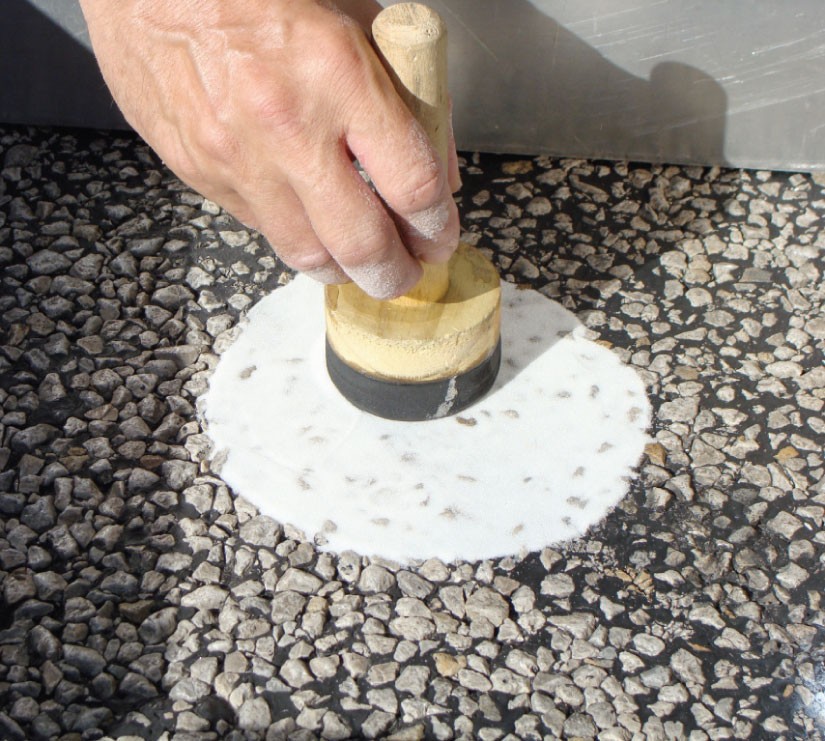
Figure 4-10. Spreading the sand to the level of the highest aggregates.�
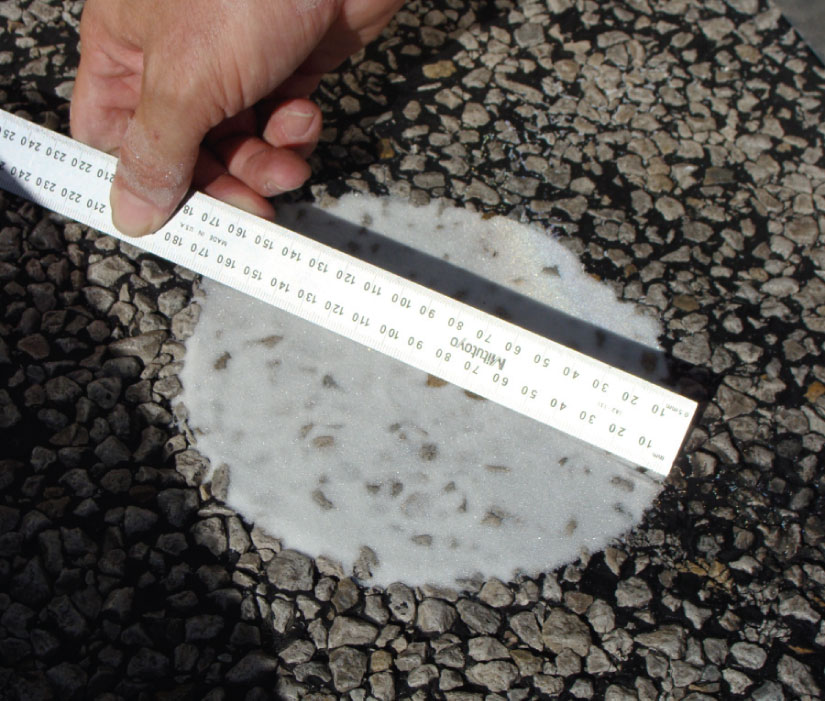
Figure 4-11. Measuring four diameters of the resulting circle for averaging.�
To give an indication of how sand patch diameters vary on different pavement textures, the average diameters found when testing the sections of pavement shown in Figures 4-3 through 4-9 are shown in Table 4-6. The test results can reveal texture differences across the roadway that otherwise would go undetected if relying solely on visual observation. The notes below Table 4-6 describe two such instances.�
Roadway and Condition | Sand Patch Average Diameters, mm | ||
|---|---|---|---|
Wheel Path | Between Wheel Paths | Difference | |
Figure 4-3 – Severe Flushing of Grade 3 Seal Coat | 199 | 111 | 88 |
Figure 4-4 – Moderate to Severe Flushing of Grade 3 Seal Coat | 200 | 117 | 83 |
Figure 3-5 – Moderate Flushing of Grade 3 Seal Coat | 174 | 129 | 45 |
Figure 4-6 – Mild to Moderate Flushing of Grade 3 Seal Coat | 177 | 129 | 48 |
Figure 4-7 – Mild Flushing of Grade 3 Seal Coat | 184 | 121 | 63* |
Figure 4-8 – Slight Color Difference across Recent Grade 4 Seal Coat | 121 | 99 | 22 |
Figure 4-9 – No Visible Color Difference across Recent Grade 4 Seal Coat | 121 | 112 | 9** |
* This higher difference was at first surprising until close observation of the pavement in Figure 4-7 revealed that some of the aggregate has been lost between the wheel paths, exposing a sharper underlying aggregate. This sharper aggregate between the wheel paths apparently increased the difference in texture across the roadway beyond what would have otherwise been expected.�
** The sand patch test revealed a difference in pavement texture in the wheel paths even though no visual indication could be observed.�
Table 4-7 provides general guidance for relating sand patch test results to desirable asphalt rate increases for outside of the wheel paths. It is recommended that a minimum of four randomly spaced locations be tested and the results averaged.�
Difference in Sand Patch Average�Diameters, mm | Asphalt Rate Increase Outside of�Wheel Paths* |
|---|---|
Less than 20 | None |
21 to 50 | 15% |
Greater than 50 | 30% |
*The user is cautioned that the guidance in Table 4-7 is based on limited data and it only considers difference in pavement texture across the roadway. Users are encouraged to refine these parameters based on their own experience with local materials sources and climatic and traffic conditions.�