Pressure Flow Method
By definition, pressure flow methods represent high flow conditions. Figure 9-13 shows a high flow condition in which the water surface at the upstream face of the bridge has impinged the lowchord but the downstream face is not submerged. You may approximate this condition as a sluice gate using Equation 9-7. You need to assume successive elevations at cross section 3 (y
3
) until the calculated discharge in Equation 9-7 is equal to the design discharge within a reasonable tolerance.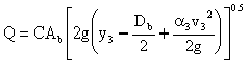
Equation 9-7.
where:
- Q= calculated discharge (cfs or m3/s)
- C= discharge coefficient (0.5 suggested)
- Ab= net area under bridge (sq. ft. or m2)
- y3= depth of flow at cross section 3 (ft. or m)
- Db= height of lowchord from mean stream bed elevation (ft. or m).
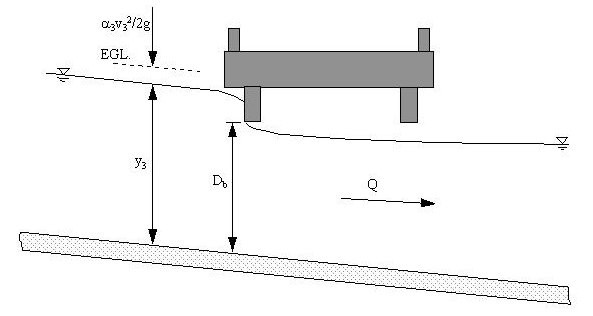
Figure 9-13. Sluice Gate Type Pressure Flow
Figure 9-14 shows a submerged bridge opening with a tailwater lower than the overtopping elevation Equation 9-8 represents orifice flow. You need to assume successive elevations at cross section 3 (y
3
) until the calculated discharge in Equation 9-8 is equal to the design discharge within a reasonable tolerance.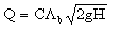
Equation 9-8.
where:
- C= discharge coefficient (0.8 typical)
- H= difference between energy grade at cross section 3 and water surface at cross section 2 (ft. or m), Equation 9-9.
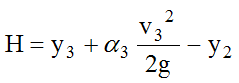
Equation 9-9.
where:
- α3= kinetic energy correction coefficient
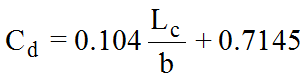
- Cd= coefficient of discharge, Equation 9-12.
Equation 9-10.
where:
- b= width of top of embankment at bridge abutment (ft. or m) (see Figure 9-15)
- Lc= length of bridge opening between abutment faces (ft. or m).
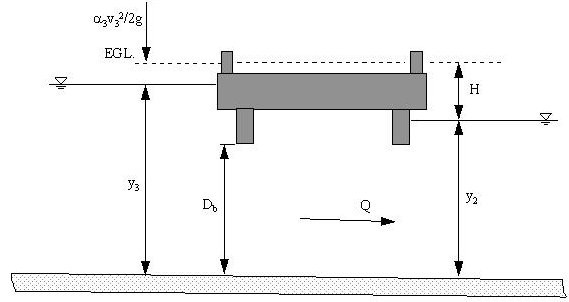 Figure 9-14. Orifice Type Pressure Flow
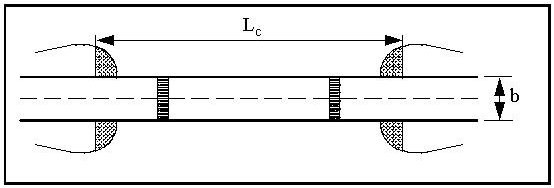 Figure 9-15. Bridge Dimensions for Pressure Flow Analysis