Velocity
While some bridge openings may have a relatively uniform velocity across the entire bridge opening, in most instances there are wide variations in the velocity profile. In some segments of the flow (e.g., near the center of the stream), the velocity may be considerably higher than the average velocity. In areas of shallow flow, the velocity may be quite low. The velocity profile may even include negative velocities (reverse flows). Figure 9-5 shows an example of a velocity profile through a bridge opening.
The through-bridge velocity is the basic sizing criterion used for span-type bridges. The average through-bridge velocity is described by the Continuity Equation (see Equation 9-1).

Equation 9-1.
where:
- V= average velocity (fps or m/s)
- A= Normal cross-sectional area of the water (sq.ft. or m2)
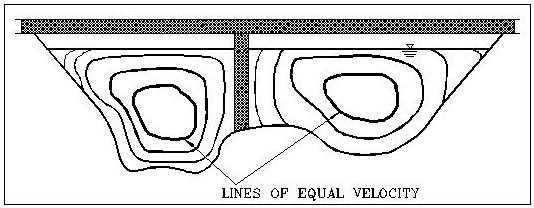 Figure 9-5. Velocity Profile Through Bridge Opening (heavier lines = higher velocity)
In general, waterway velocities should replicate the velocity of the natural channel. Higher velocities may be acceptable in certain cases where the streambed is rocky or the bridge headers are sufficiently removed from the erosive effects of floodwaters.