Shoreline Change
Shoreline change can be long-term, short-term, or storm induced/episodic and is often expressed in terms of the average change in shoreline position with time (e.g., 1 foot per year). Shoreline change can also occur in several directions, including moving landward (recession) or seaward (accretion). Shoreline change differs from scour in that a scour analysis focuses on structural assets, like a roadway or bridge, while shoreline change is a large-scale view of a section or region of coastline. The difference between coastal scour and coastal shoreline change is similar in principle to riverine contraction and local scour of structural assets, as compared to the long-term aggradation and degradation of the stream bed and lateral stream migration in riverine systems.
Dynamics
Wind, waves, and currents are the primary forces that move sediment and larger stones. If a change occurs in the pattern of winds, waves, currents, or sediment supply, then shoreline change can occur. Another impact that can change the forces listed above is variation in the sea level. Changes in sea level, discussed in Section 2, can affect where the shoreline and nearshore processes occur and influence the shoreline elevation and width. The presence of shoreline features, such as tidal inlets and coastal engineering structures (e.g., jetties and breakwaters) can also affect shoreline change, as they can exacerbate or attenuate wave and current conditions, depending on their location.
Episodic or storm-induced shoreline change can cause significant retreat or impacts to a shoreline. An individual storm may cause significant erosion or even trigger the beginning of an erosional period (an erosional period is a short-term change that may not relate to or follow long-term shoreline trends). Specific to Gulf shorelines in Texas, large storms on low-lying barrier islands can cause island rollover and migration, or in some locations may remove large amounts of sand from the beach. Island rollover and migration occurs as storm surge moves sediment along the barrier islands landward. It can take years for a Gulf shoreline to naturally recover from a storm, although sometimes the culmination of lesser storm activity can result in the replacement of much of the sand that was lost. It should be noted that storm-induced erosion of bay shorelines is not typically followed by any shoreline recovery, as bay shorelines are commonly clay- and bluff-based shorelines that do not have the dynamic ability to recover as a Gulf sand-based shoreline does.
Beyond storm-induced changes, long-term changes along Texas coastlines are driven by sediment movement and the typical annual current and wave conditions, or even typical vessel wakes. These long-term trends are more frequently recognized at the regional level, particularly for Gulf shorelines. Most Texas Gulf shorelines are considered eroding over the long-term, with some net neutral or accreting locations near the central Texas coast. This is the result of a general trend for net positive longshore sediment movement towards the central Texas coast; however, there are localized exceptions resulting primarily from groin structures interrupting the natural occurring sediment movement.
Quantifying Shoreline Change Rates
Shoreline change rates vary along the Texas shoreline and through time. When evaluating shoreline change rates, it is important to consider all available observations and as long of a period of record as possible. Long-term shoreline change typically refers to historic time scales where measurements were recorded (e.g., 1800s to present) and is useful for understanding potential impacts to roadway infrastructure through the coming century. In contrast, short-term shoreline change is typically calculated using recent multi-decadal timescales (e.g., 1970s to present). Understanding short-term shoreline change is useful for evaluating impacts to a project that may occur at an earlier planning time frame, or if the project is in an area that has been largely influenced by human activity, such as engineering shoreline protection structures, in recent decades.
While there is no national or state standard for shoreline change analyses, there are common approaches to quantifying changes. Mapped historical shoreline positions are often used to interpret the movement of shorelines through time, and linear regression statistical approaches are useful to approximate change rates that vary along the shoreline (Figure 15-29). Observed rates are commonly extrapolated into the future to assess future long-term impacts at design sites. This approach is especially valuable when planning the future location of highways located in areas with receding shorelines.
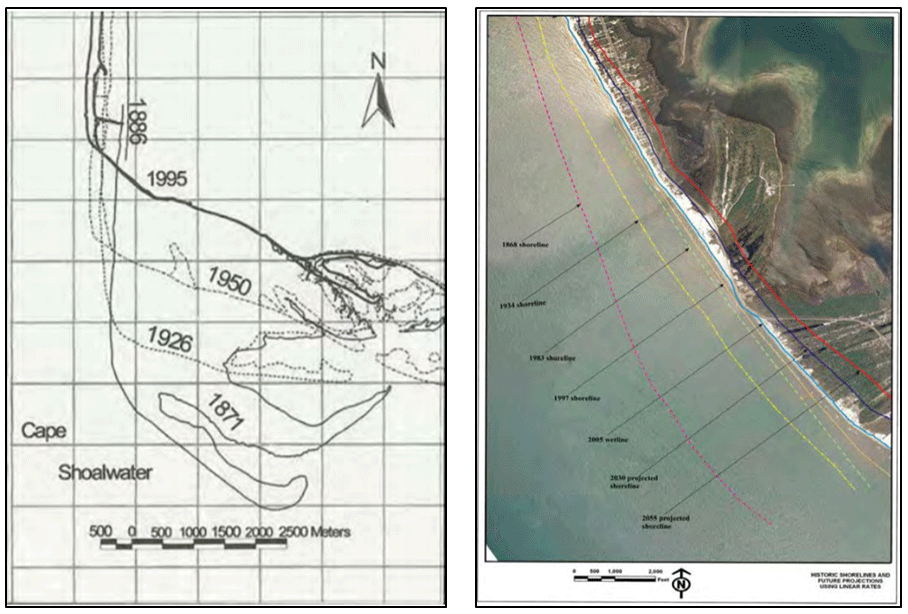
Figure 15-29. Example of Historic (left) and Projected Future (right) Shoreline Positions (FHWA, 2008)
Historical shoreline data for Texas Gulf shorelines is primarily documented through the
managed by the Bureau of Economic Geology (BEG) at the University of Texas (Figure 15-30).
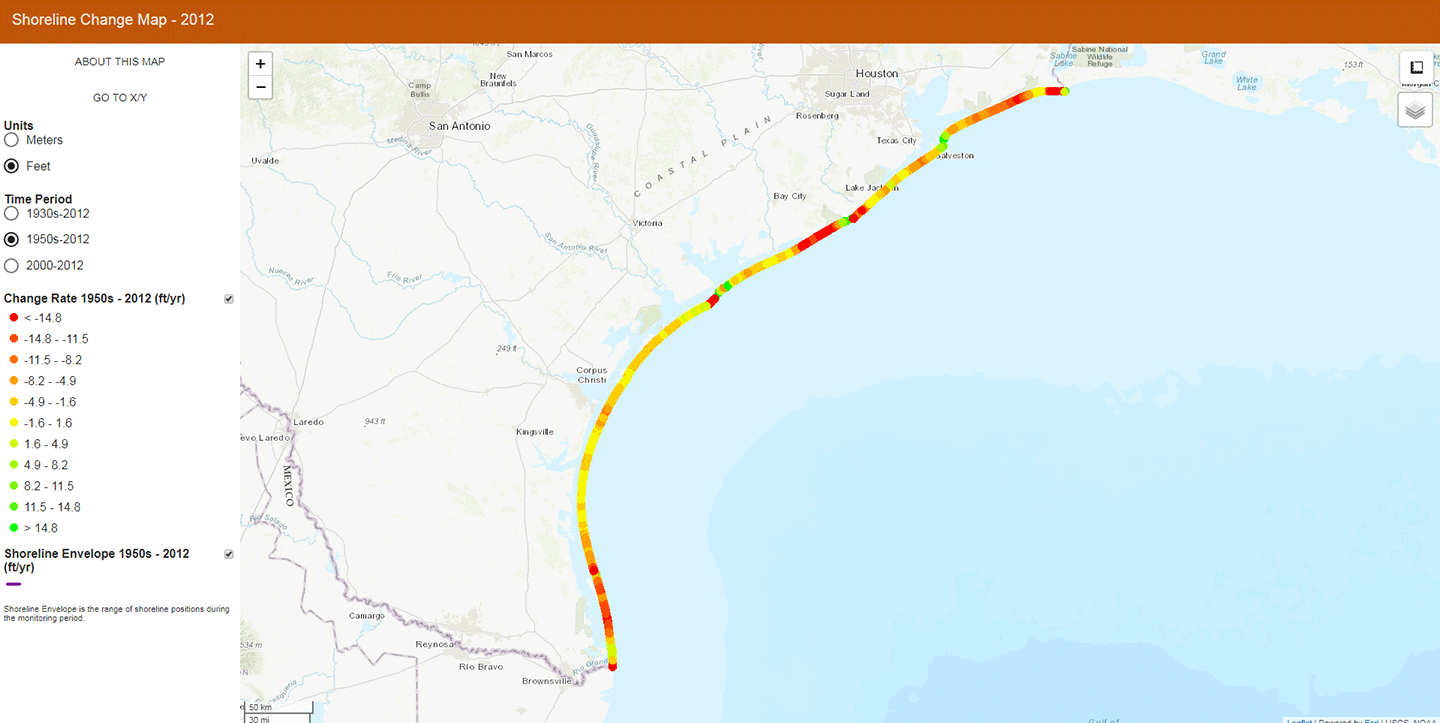
Figure 15-30. Shoreline Erosion Map Interface for BEG Gulf Shoreline Tool (as of 2012)
Bay shoreline data is not widely available within Texas for historical rates, and frequently the best alternative is to utilize historical imagery to identify trends, with Google Earth serving as the primary option.
Some limitations to using historic shoreline change rates to estimate future shoreline position include:
- Shoreline processes are often not linear with time;
- Human influence may have influenced historic shoreline changes;
- Human influence may influence future shoreline change; and
- Data collected is limited to human record timeframes.
Local sediment budgets play a large role in the dynamics of shoreline change. Sediment budgets describe the input, transport, storage, and export of sediment along the shoreline. Whether evaluated quantitatively or qualitatively, all sediment budgets are conceptually understood by a continuity equation stating that during a given time period, the amount of sediment coming into the area minus the amount leaving the area equals the change in the amount of stored sediment. Historical aerial imagery as well as survey can be used to evaluate long-term trends in the shoreline as mentioned above but review of the sediment budget can also be used to estimate future shoreline positions.
Sediment budgets typically require much more data and analysis than simple shoreline change extrapolation. Aerial photography and remote sensing can be used to quantify visual and volumetric changes in sediment along a shoreline. In addition, sediment sampling in the water column and along the seafloor can be combined to develop data needed for sediment transport models. In the mapping or quantifying of sediment transport, specific erosion problems can be identified or better understood in order to develop appropriate site-specific solutions. Figure 15-31 is an example of a sediment budget evaluation and map. The sediment budgets were determined through volumetric methods that evaluated the beach profile changes from 1973-1997.
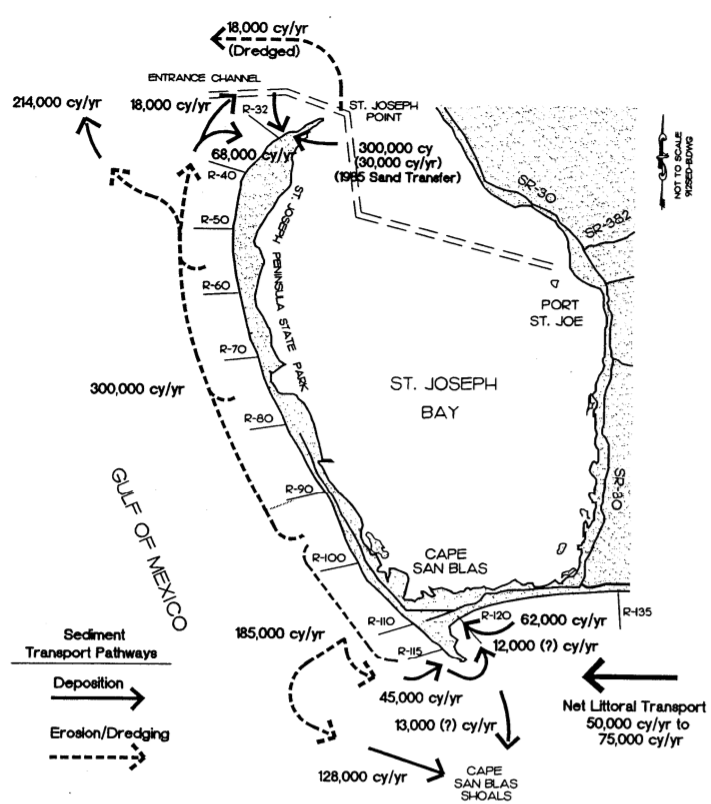
Figure 15-31. Example of a Coastal Sediment Budget (FHWA, 2008)
Numerical Modeling of Shoreline Change
In addition to prorating historical trends of shoreline change, numerical models have been developed to estimate future shoreline positions. Few numerical models can accommodate all of the design factors discussed in this chapter within the same model. Models also vary in their degree of complexity, ranging from 1D to 3D capabilities. Sediment transport models have more inherent uncertainty than hydrodynamic models, as they must consider additional factors such as sediment grain size and sources/sinks of sediment. Figure 15-32 shows inputs per level of analysis and available modeling for each level.

Figure 15-32. Shoreline Change Level of Analysis Inputs and Applicable Models.
The most common method for estimating future shoreline positions is direct extrapolation of historic shoreline change rates to the present shoreline from historic maps and aerials. Shortcomings in this method include the fact that shorelines change processes may not be linear with time; it is difficult to tie the shorelines to a specific datum, engineering may have impacted shoreline change in the past and may impact future change. If an area is rural and has experienced minimal engineering design along its coast, then historic maps and aerials can be appropriate for shoreline change. If shoreline change and modeling is required for a large study area with many engineered structures and recorded shoreline change, it is usually necessary to use a highly advanced model to achieve the sediment transport detail needed for design.
Dredging can play a large role in shoreline change and especially in sites adjacent to the GIWW. Sargent Bridge in Texas is an example of an abutment being designed for future dredging depth and impacts, rather than current conditions. This bridge site and the large area impacted by repeated or planned dredging would be a candidate for advanced modeling to evaluate shoreline change and sediment transport.
The type of project may dictate when to choose between a long-term and a short-term analysis. When evaluating short-term shoreline change due to extreme events, such as hurricanes, available data may limit the type of approach. The validation and calibration of such short-term shoreline change models is only possible when the available data, such as shoreline positions and elevations, are available both before and after the storm event. Modeling a short-term change is needed to calibrate the model to review long-term changes. Long-term change models can then include several probable storm events. Such data has become more common thanks to technological advancements in elevation data collection. Pre-storm and post-storm shoreline position and elevation data are available in limited locations for some recent storms in the form of coastal LiDAR data. Data can be obtained from the
web portal.
Impacts on Coastal Structures
Roadways and other transportation assets along the coast are vulnerable to shoreline change (Figure 15-33). Once shoreline change has been identified as a design factor impacting a roadway asset, the vulnerability should be assessed. One method to determine vulnerability is to map the elevation and shoreline positions near structures versus the long-term recession rate (the long-term recession rate is the long-term shoreline change at an area that is determined to be recessing landward), using methods previously outlined. The less time a structure has until exposed by shoreline recession, the greater the potential vulnerability. This approach should also be combined with consideration of short-term or storm-induced erosion to help prioritize structures with a high potential for exposure to erosion. Early consideration is highly beneficial for planning repair, protection, or relocation strategies. If possible, transportation structures vulnerable to shoreline change should be considered for relocation to a landward position. However, if relocation is not an option due to adjacent private property, environmental concerns, or other issues, engineered shoreline stabilization combined with monitoring may provide long-term protection.
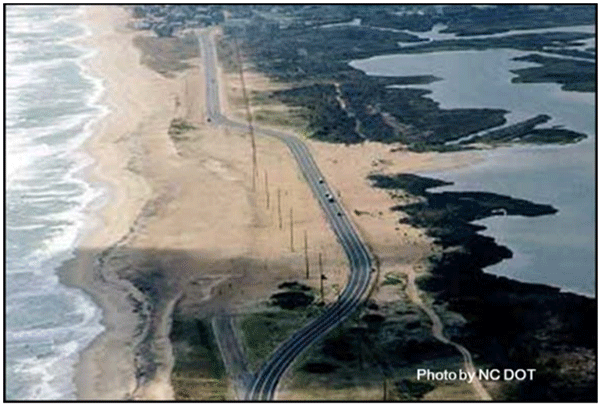 Relocation example in North Carolina (FHWA, 2008) |
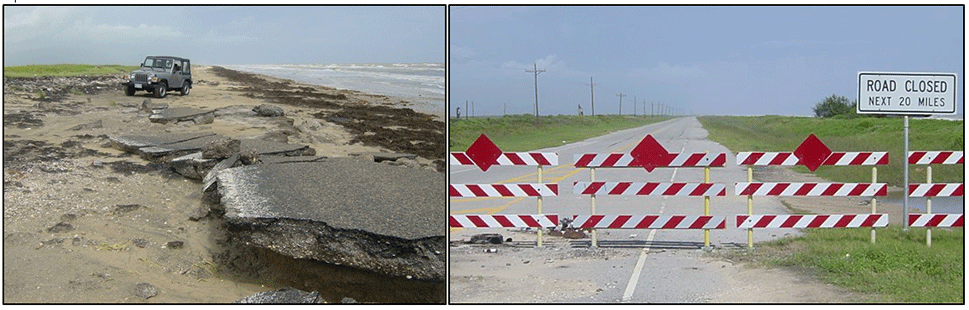 Road destroyed by shoreline recession: SH87 in Jefferson County, Texas was destroyed during Hurricane Ike. Due to shoreline retreat, it is not viable to be rebuilt in its current location. |
Figure 15-33. Examples of Roadways affected by Shoreline Change.
As discussed in the
Scour Mitigation Measures
subsection, stabilization or remediation can be achieved through both hard engineering (e.g., seawalls, groins, breakwaters, and hybrid structures) or soft engineering measures (e.g., beach nourishment, dune regeneration, creating marshland, and vegetative plantings). A combination of techniques is often most effective in ensuring success. Mitigation measures for shoreline stabilization are similar to mitigation for scour but should be viewed on a broader scale in terms of sediment transport. Right-of-ways are often narrow, and joint efforts or partnerships may be required for roadway revetment and combination of hard and soft protection.Shoreline Change Data Sources
- U.S. Geological Survey— USGS provides historical shoreline positions and calculated short-term and long-term shoreline change rates for many areas along the Gulf Coast.
- NOAA Coastal Services Center Digital Coast— Data is available through NOAA Digital Coast web portal.
- University of Texas Bureau of Economic Geology— The Texas General Land Office, working with the University of Texas BEG, maintains and updates coast-wide erosion rates for Texas Gulf shorelines to estimate the areas of greatest long-term shoreline change in Texas. This information can be reviewed on their interactive map. .
- Federal Highway Administration— discusses quantifying shoreline change rates and provides descriptions of the multiple ways that a roadway and shoreline can experience shoreline changes. Also discussed are the modeling methods for analyzing shoreline change.