Design Elevation and Freeboard Calculation Examples
Example design calculations for each level of analysis, including freeboard considerations, are shown in Table 15-7 through Table 15-9 for the process of determining of a final design elevation. Project design elevation should also consider whether the project is a repair, replacement, or new alignment. For repairs and replacements, elevation changes could be more constrained and storm return periods or individual considerations, such as relative sea level rise, should be evaluated for practicality.
Level 1 Analysis Example | ||
|---|---|---|
Step | Activity | 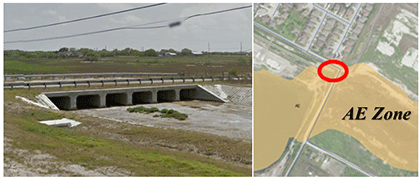 |
1 | Determine Storm Tide Elevation Section 2 | Obtain appropriate FEMA flood map elevations for study area FEMA FIS Report Summary of Stillwater Elevations of 10 ft for 100-year design storm tide and 8.4 for 50-year design storm tide. *Zone AE BFE shown on Flood Insurance Rate Map includes wave effects and runup and should not be used for stillwater elevation, reference the FIS for stillwater elevations. |
2 | Determine Relative Sea Level Rise Rate Section 2 | Obtain RSLR rates for project life cycle Located in Nueces County, Region 3. Assumed 50-year design life for roadway and bridge starting in 2020. Relative sea level for 2070 is 3.0 ft per Section 2 guidance. |
3 | Interpolate Project Specific Relative Sea Level Rise Section 2 | The 3.0 ft for 2070 minus 0.7 ft from 2020. Sea level change of 2.3 ft for project life. |
4 | Calculate Stillwater Elevation | Add the result of Step 3 (RSLR) to the elevations obtained in Step 1 (storm tide)
|
5 | Obtain Ground Data Section 2 | Obtain appropriate ground surface elevation maps for study area LiDAR and bathymetry from TNRIS show an average channel elevation of 7 ft. *Ground elevation should be confirmed with plans, survey, or bathymetry. |
6 | Determine Stillwater Depth | Subtract ground elevations (Step 5) from values found in Step 4 to obtain flood depth
|
7 | Determine Maximum Wave Height Section 3 | Multiply stillwater depths (Step 6) by 0.8 to determine maximum wave height.
*If the project is located adjacent to a FEMA coastal transect, it is also possible to determine appropriate wave parameters from the Flood Insurance Study documentation. If wave heights significantly exceed the FEMA designated zone, a different method should be considered, such as Level 2 techniques. For example, if landward of the LiMWA, wave heights should likely not exceed approximately 1.5 feet, and if in an AE zone rather than a VE, they should not exceed 3 feet. Inclusion of RSLR could impact FEMA data applicability in some cases . |
8 | Determine Wave Crest Elevation (Design Elevation w/out Freeboard) | Multiply maximum wave height (Step 7) by 0.75, add to Step 4 for wave crest elevations. 75% of the wave height being above the stillwater elevation is a standard estimate for basic wave calculations (HEC-25).
*These values should be compared to historical storm observations, while considering adjustments for RSLR. If there are significant discrepancies, a Level 2 analysis may be warranted. |
9 | Determine Freeboard Section 4 | Consider freeboard based on road classification and site conditions. Local roads and streets, non-critical, do not require freeboard per AASHTO guidance. Per guidance in this chapter, bridged waterways analyzed with Level 1 methods recommend 2.0 ft freeboard over the design storm tide plus wave height. Both an example of bridge calculations and roadway calculation are shown in Steps 10 and 11. |
10 | Determine Bridge Design Elevation (Low Chord) Section 4 | The bridge low chord design elevation is determined using the freeboard from Step 9 and the 50-year design elevation from Step 8.
*Application of wave effects, RSLR, and freeboard should be evaluated for each project independently. These calculations can be completed removing individual components as appropriate. |
11 | Determine Roadway Design Elevation Section 4 | The roadway design elevation is determined using the 50-year return period based on roadway classification in AASHTO guidance documents. Because there is no freeboard recommended, the design elevation is the same as the elevation determined in Step 8, 12.92 feet. *Application of wave effects, RSLR, and freeboard should be evaluated for each project independently. These calculations can be completed removing individual components as appropriate. |
Level 2 Analysis Example | ||
|---|---|---|
Step | Activity | 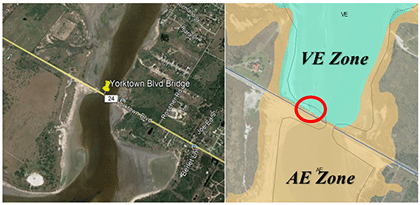 |
1 | Determine Storm Tide Elevation Section 2 | Obtain appropriate FEMA flood map elevations for study area Multiple return periods could be required for additional calculations such as scour, but for simplicity, only the 50-year return period is shown in this example for establishing deck elevation. FEMA FIS Report Summary of Stillwater Elevations of 12.5 ft for 50-year design storm tide. *Zone AE BFE shown on Flood Insurance Rate Map includes wave effects and runup and should not be used for stillwater elevation, reference the FIS for stillwater elevations. |
2 | Determine Relative Sea Level Rise Rate Section 2 | Obtain RSLR rates for project life cycle Located in Orange County, Region 1. Assumed 75-year design life for bridge starting in 2020. Relative sea level for 2095 is 5.15 ft per Section 2 guidance. |
3 | Interpolate Project Specific Relative Sea Level Rise Section 2 | The 5.15 ft for 2095 minus 0.8 ft from 2020. Sea level change of 4.35 ft for project life. |
4 | Calculate Stillwater Elevation | Add the result of Step 3 (RSLR) to the elevations obtained in Step 1 (storm tide)
|
5 | Obtain Ground Data Section 2 | Obtain appropriate ground surface elevation maps for study area LiDAR and bathymetry from TNRIS show an average elevation of 4 ft. *Ground elevation should be confirmed with plans, survey, or bathymetry. |
6 | Determine Stillwater Depth | Subtract ground elevations (Step 5) from values found in Step 4 to obtain flood depth
|
7 | Determine Maximum Wave Height Section 3 | Utilizing stillwater data obtained previously and local historical wind data from a nearby NOAA station, develop a wave analysis using a 1D wave model such as Coastal Engineering Design and Analysis System (CEDAS) or through spreadsheet-based calculations. Model inputs include water depth, wind speed and duration, fetch length, typical temperature and project latitude. The resulting datasets should be statistically evaluated to determine a 50-year return period value for wave height and period. This example analysis yielded a 50-year wave height of 3.81 feet and a wave period of 3.82 seconds. |
8 | Determine Wave Crest Elevation (Design Elevation w/out Freeboard) | Multiply design wave height (Step 7) by 0.75, add to Step 4 for wave crest elevations. 75% of the wave height being above the stillwater elevation is a standard estimate for basic wave calculations (HEC-25).
*These values should be compared to historical storm observations, while considering adjustments for RSLR. If there are significant discrepancies, a Level 3 analysis may be warranted. |
9 | Determine Freeboard Section 4 | Consider freeboard based on road classification and site conditions. Per guidance in this chapter, bridged waterways analyzed with more approximate Level 2 methods recommend 2.0 ft freeboard over the design storm tide plus wave height. |
10 | Determine Bridge Design Elevation (Low Chord) Section 4 | The bridge low chord design elevation is determined using the freeboard from Step 9 and the 50-year design elevation from Step 8.
*Application of wave effects, RSLR, and freeboard should be evaluated for each project independently. These calculations can be completed removing individual components as appropriate. |
Level 3 Analysis Example | ||
|---|---|---|
Step | Activity | 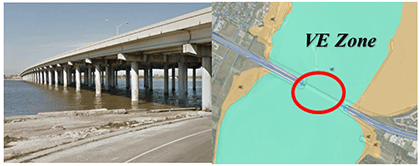 |
1 | Determine Storm Tide Elevation Section 2 | Select, develop, and prepare appropriate numerical modeling tools 2D and 3D hydrodynamic, wave, storm surge, and morphologic models (e.g., ADCIRC+SWAN, Delft3D, MIKE3). Calculations required for design could determine whether a 2D or 3D model is required. If scour is expected to be critical, a 3D may be necessary to account for complex current patterns at the structure. Validate and/or calibrate the models through hindcast simulations and analysis. Review past storms for data to use in calibrating the chosen model. Elevations will be determined concurrently with Step 8. |
2 | Determine Relative Sea Level Rise Rate Section 2 | Obtain RSLR rates for project life cycle Located in Galveston County, Region 1. Assumed 75-year design life for bridge starting in 2020. Relative sea level for 2095 is 5.15 ft per Section 2 guidance. Review of current guidance or projections for RSLR should be considered and best available data should be utilized. |
3 | Interpolate Project Specific Relative Sea Level Rise Section 2 | The 5.15 ft for 2095 minus 0.8 ft from 2020. Sea level change of 4.35 ft for project life. Incorporate into water level inputs or similar model parameters. |
4 | Calculate Stillwater Elevation | Step completed concurrently with Step 8. |
5 | Obtain Ground Data Section 2 | Obtain appropriate ground surface elevation maps for study area and surrounding water body as needed. An integrated LiDAR and bathymetry based digital elevation model will be necessary to utilize the model selected in Step 1. The extent of required data is dependent on the model mesh extents. |
6 | Determine Stillwater Depth | Internal calculations within model. |
7 | Determine Maximum Wave Height Section 3 | Step completed concurrently with Step 8. |
8 | Determine Wave Crest Elevation (Design Elevation w/out Freeboard) | Using the hydrodynamic model, run the desired simulation for the design storms to get the information needed for design elevation: water levels, wave heights, and velocity. Derive probabilities associated with water levels, wave heights, velocity, etc. as appropriate for the selected model. |
9 | Determine Freeboard Section 4 | Consider freeboard based on road classification and site conditions. Per guidance in this chapter, 1.0 ft minimum freeboard is recommended for bridged waterways. Based on project specific observations and concerns with regards to debris, 3.0 ft freeboard is selected. |
10 | Determine Bridge Design Elevation (Low Chord) Section 4 | The bridge low chord design elevation is determined using the freeboard from Step 9 and the 50-year design elevation from Step 8. *Application of wave effects, RSLR, and freeboard should be evaluated for each project independently. These calculations can be completed removing individual components as appropriate. |
TxDOT design flood and check flood minimum standards can be found in Chapter 4 (Hydrology), Section 6 (Design Flood and Check Flood Standards). In some cases, it may be required to calculate additional design storms for scour computations per the
, Chapter 5 (Foundation Design), Section 6 (Scour).