Waves
Waves are caused by a disturbance of the water surface. The origin of the disturbance may be winds, boat or ship wakes, or other forces, such as underwater landslides due to earthquakes (tsunamis). Most waves observed at the shoreline are generated when wind blows over a vast expanse of the sea. Winds, especially during storm events, can impart a tremendous amount of energy into waves. After storm waves are formed, they may propagate across the surface of the sea for thousands of miles until their energy is dissipated, usually through wave breaking. Once waves arrive at the shoreline, their energy can be the primary cause of erosion or may generate nearshore currents and influence sediment transport patterns.
Several equations and theories have been developed to approximate wave characteristics, but the most basic approximation is to assume a regular sinusoidal wave. Linear wave theory applies numerous simplifying assumptions to wave calculations—for instance, that each wave does not interact with any other fluid motions (including other waves) and that waves maintain a sinusoidal shape. In reality, waves are typically much more complex and nonlinear, often propagating as a random mix of larger and smaller waves. For more complex cases, numerical models can be applied (refer to Numerical Modeling of Waves subsection). Numerical models include influences from bay and channel geometry, wind, bathymetry, and other factors. They are often computationally intensive and will likely require consultation with a coastal engineering specialist.
For the Texas coastline, wave impacts should be considered for transportation infrastructure along the open coast, as well as infrastructure that is subject to locally-generated waves within bays and inlets, and boat traffic-induced wakes acting on shorelines in navigation channels, such as the Gulf Intracoastal Waterway (GIWW).
Site-specific wave data can provide insight into the type and magnitude of wave forces at a structure. This information can be collected through direct measurements that are used as inputs in numerical or physical models. Direct measurements of waves in the vicinity of the project during a specific period of time can be collected via a wave gauge; however, it should be cautioned that gauges capture constantly changing wave condition requiring an analysis in order to obtain statistically representative wave data. Numerical or physical modeling may be conducted to approximate the design wave characteristics using inputs including wind, stillwater levels, and bathymetry, which are often readily available from monitoring stations. Additionally, or alternatively, the USACE Wave Information Studies (WIS) system provides wave hindcasts, or predictions based on past events and wind observations, that can be used to better understand the approximate wave characteristics. More information on WIS is discussed in the data sources below. Wave measurements and hindcasts tend to be publicly available for areas within the Gulf of Mexico but are generally not available for Texas bays and estuaries.
Wave Dynamics
Almost all waves in the Gulf of Mexico and Texas bays are generated by winds. The heights and periods of wind-generated waves, important parameters used in engineering calculations, are governed by wind velocity, the duration of time that the wind blows, and the fetch, or distance, over which the wind blows (Figure 15-12). Because the fetch distance restricts the time during which energy can be transferred from wind to the waves, longer fetches, such as the open coast, tend to generate larger waves than will be experienced in shorter fetch areas, such as a bay. Other factors, such as water depth and overall bathymetry, also affect wave generation, growth, and propagation.
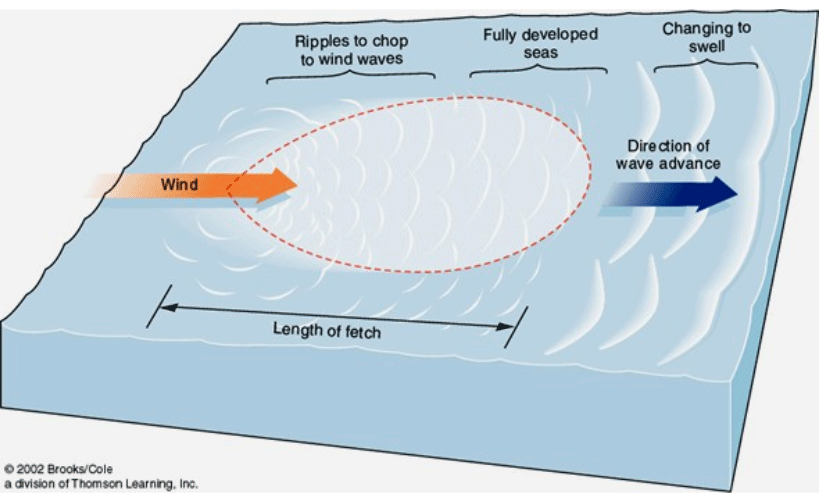
Figure 15-12. Conceptual Drawing of Length of Fetch (Brooks/Cole, 2002)
During a storm, wave patterns are highly complex and disorganized as the storm generates many different sets of waves with varying wave heights and little predictability over the length of fetch. As waves leave the storm area, they become more sorted (organized) based on their wave speeds and develop into a swell, having uniform wave heights and energies. The motion of a developed swell is periodic, or repetitive through fixed periods of time.
Figure 15-13 depicts basic parameter definitions for waves. The length dimensions used to define the wave are the wavelength (L), defined as the distance between wave crests, and the wave height (H), defined as the difference between the elevation of the crest and trough of an individual wave. The water depth (d) is defined as the distance from the bottom surface to the stillwater level (SWL), which is the level of water if waves were not present. The wave period (T) is the time required for a wave to travel one wavelength.
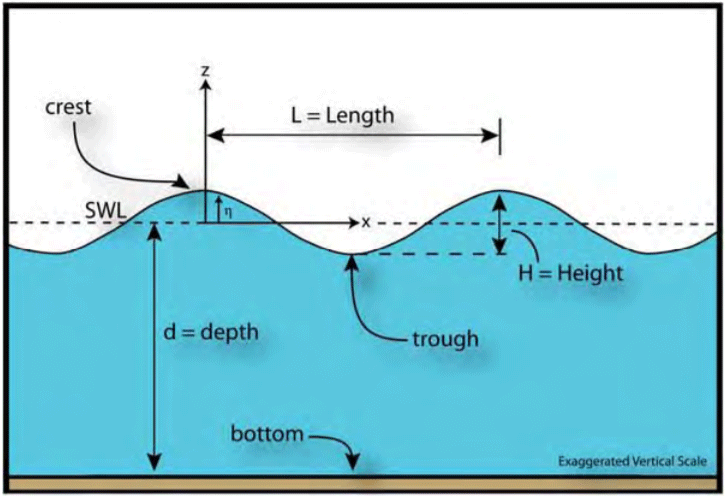
Figure 15-13. Wave Parameter Definitions (FHWA, 2008)
Design Wave Height
Designing to consider the maximum wave height is typically not warranted, because the maximum wave has the chance of being a statistical outlier or a measurement error and putting undue cost burden on project design and construction compared to the probability of occurrence. A commonly used way to apply wave height information in infrastructure design is through a parameter known as the significant wave height. This is a statistically-derived average of the highest one third of the waves measured over a period of time. The significant wave height is important to capture the potential impact of larger waves, which are more ‘significant’ than the smaller waves in terms of infrastructure impacts in coastal environments. The standard sampling time to measure the state of the sea is usually around 17 to 20 minutes, which represents the time interval needed to capture consistent conditions (Thompson, E.F. and C.L. Vincent, 1985). Sampling over shorter time periods may introduce too much variability and give incorrect results for the significant wave height.
Wave Breaking
Within the nearshore zone is a location where waves begin to enter shallow water, creating increases in wave height as waves move towards the shoreline. This process of wave transformation is also known as shoaling. When waves increase in height, they become steeper and begin to break in the relatively narrow area of the nearshore that contains wave breaking, called the surf zone. The impact of breaking waves on coastal infrastructure is an important design consideration.
Breaking waves create significant turbulence and energy transfer to the feature they impact. In shallow water, waves break when they reach a limiting shallow depth (depth-limited breaking). Eventually, the waves become overly steep and break with the crest thrown forward as the wave dissipates near the shoreline. This phenomenon typically occurs as waves enter water that is approximately as deep as the waves are high. As waves travel landward, shoaling begins to occur and the ratio of wave height to water depth increases. After breaking, the wave may reform as a smaller wave and continue propagating towards the shoreline. This pattern may occur repeatedly until the wave becomes completely dissipated in shallow water.
The depth-limited breaking conditions in shallow water can be a very important consideration in the design of coastal revetments that protect highways and when determining coastal bridge elevations. A practical value for determining appropriate wave heights used in design for Texas, where there is a mild, sandy slope offshore of the roadway structure, is:
Equation 15-1.(HEC-25)
Where:
- d= local water depth (including tides and storm surge)
- H= wave height
This relationship can be rearranged to describe the depth-limited wave height as:
Equation 15-2.(HEC-25)
This relationship is useful in selecting the upper limit for a design wave height for coastal structures in shallow water. Given an estimate of the water depth at the structure location, the maximum wave height (
H
) that can exist in the depth of water is known. Any larger waves would have broken farther offshore.max
Wave Refraction
As waves enter shallow water, they are subject to a process called wave refraction, which is the directional change waves experience as they propagate over different depths. Wave refraction is important to consider in roadway and bridge design, as it can affect local wave height and influence the strength and speed of waves reaching structures. Along typical (relatively straight) coastlines, waves tend to become parallel with the shoreline as shown in Figure 15-14. This occurs due to the faster movement of waves in deeper water than shallower water, causing the wave to rotate. Irregular bottom topography or shorelines can cause complex wave refraction, producing significant variations and wave heights and energies along the coast (Figure 15-15). For instance, if waves encounter an obstruction, such as a reef, on the sea floor, waves will start to refract around it, converging and focusing their energy at the center of the obstruction. This creates higher, more powerful waves near the obstruction area. Conversely, if waves encounter a large, convex coastline, such as a shallow bay, waves start to bend outwards, diverging and dispersing energy away from the shoreline and reducing the wave height. Wave convergence or divergence due to refraction is an important consideration for sizing and placing coastal armoring for transportation infrastructure.
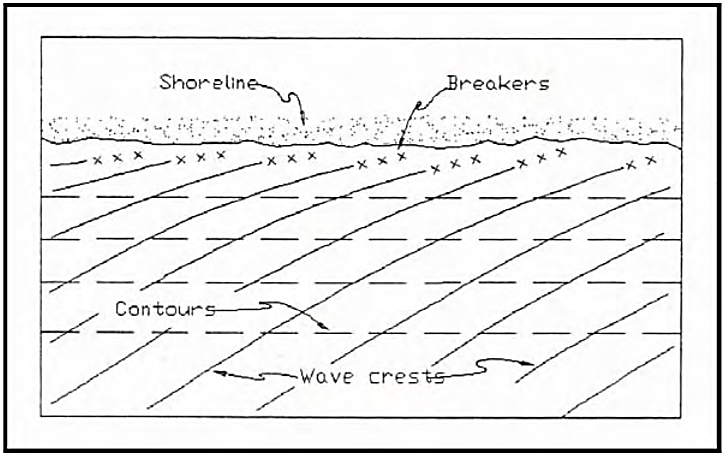
Figure 15-14. Example of Wave Refraction along a Straight Shoreline (USACE, 2002)
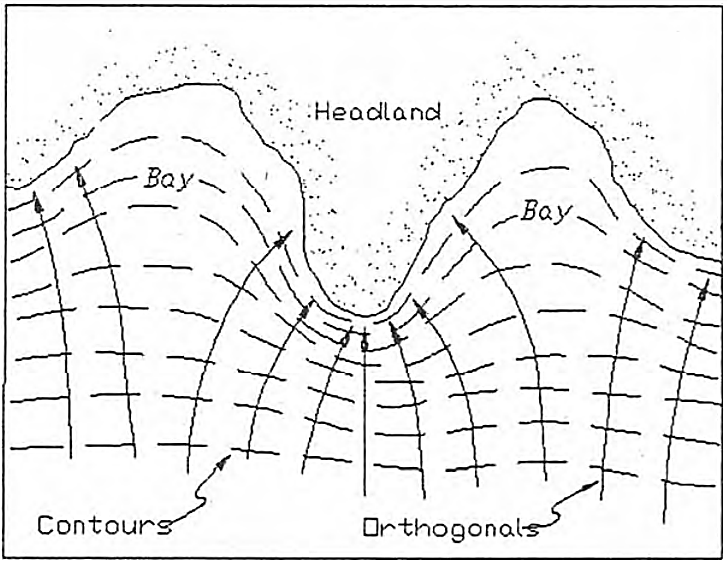
Figure 15-15. Example of Wave Refraction along a Complex Shoreline (USACE, 2002)
Wave Diffraction
Wave diffraction is another nearshore process related to wave refraction. The phenomenon occurs when waves propagate past a structure (e.g., jetty or breakwater), barrier island, or narrow inlet opening (Figure 15-16). The feature interrupts the wave energy and changes wave direction as waves wrap around the feature. Although wave refraction and wave diffraction both affect the direction of waves, refraction is affected by water depth while diffraction is not. The process of wave diffraction often creates a sheltered zone of low energy on the opposite side of the feature being impacted. It can, therefore, be an important consideration when placing coastal armoring, such as breakwaters, to attenuate wave energy and protect roadways vulnerable to erosion forces.
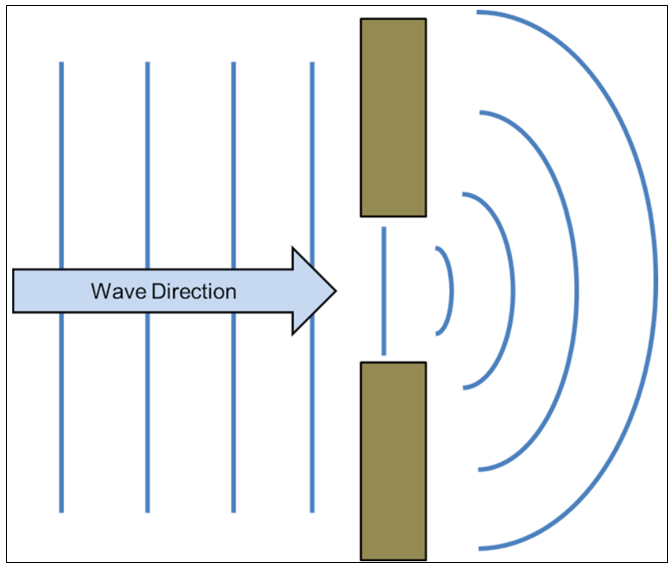
Figure 15-16. Example of Wave Diffraction (
)
Wave Reflection
A third way that waves can change is when waves encounter vertical structures (e.g., bulkhead or seawall). In these cases, the waves may reflect, or bounce back, from the shoreline. Depending on the amount of energy remaining in the wave, reflection may cause complex wave interactions, enhance local wave heights, and increase the likelihood for scour at the base of the vertical structure. Therefore, local wave patterns are important to understand prior to placing vertical armoring.
The Influence of Barrier Islands
The Texas shoreline is characterized by a chain of barrier islands that separate the bays from the Gulf of Mexico. These narrow islands provide the first line of defense for storm surge and reduce the wave energy that reaches the mainland. The low-wave energy area landward of the islands provides a sheltered environment for estuaries to form and helps create more stable shorelines on the mainland.
Barrier islands are highly dynamic landforms that evolve in shape and migrate due to changes in sea levels and wave forces. Over time, the islands often migrate toward the mainland, as waves wash over the islands during storms and transport sediment from the Gulf side to the inland side.
Built infrastructure, such as roadways, on barrier islands interrupts the islands' natural evolution. To protect established infrastructure, armoring (e.g., seawalls and groins) and beach nourishment practices are commonly used to maintain the existing barrier island position. Regardless of engineering attempts to preserve the islands, large hurricanes commonly overwash the features, damaging infrastructure, or breach the islands, creating new inlets.
Changes to the shape of the islands or their diminishing due to sea level rise or erosion may lead to increased exposure of infrastructure located on the barrier islands and the mainland.
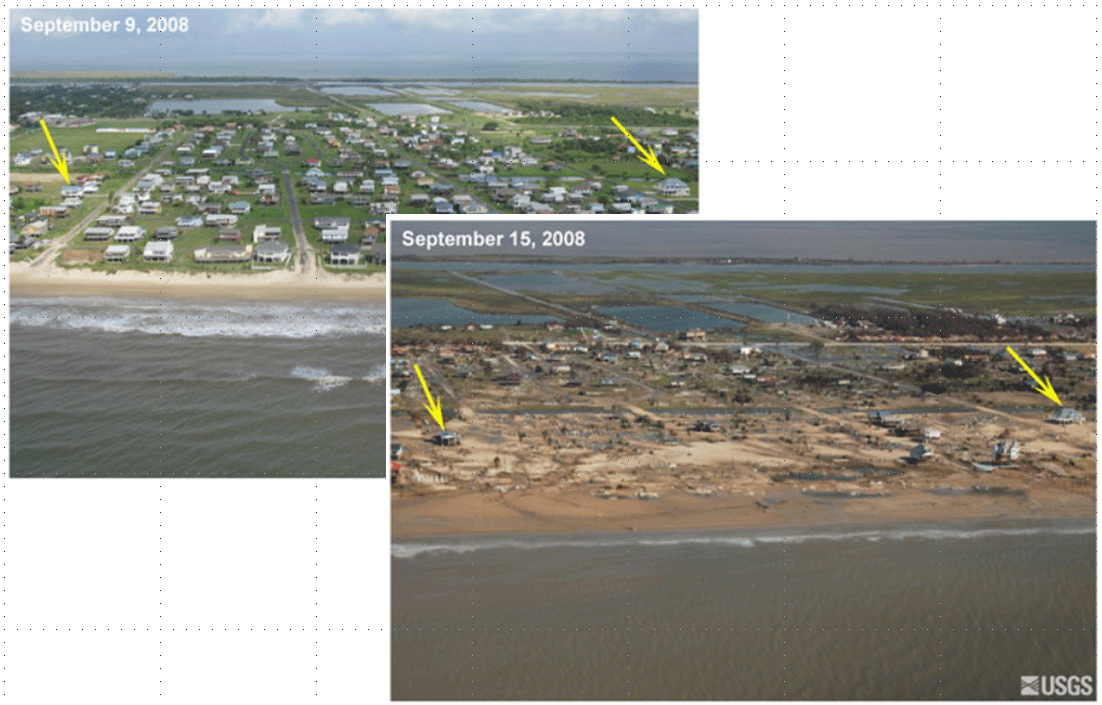
Figure 15-17. Damages on Bolivar Peninsula following Hurricane Ike.
Wave Dynamics Sources
The following two sources can be used for wave dynamic sources data. However, due to the complex nature of waves, in many cases, wave generation, growth, and transformation are challenging to determine using empirical methods alone.
- USACE Coastal Engineering Manual (CEM)— Relatively simple empirical methods for wave calculation are presented in Part 2, Chapter 2 of the . These can be useful references for estimating potential wave heights for fetch-limited conditions, breaking wave heights, and wave heights associated with a variety of hurricane strengths.
- HEC-25— This can be a useful reference for empirical methods for wave calculation.
Wave Impacts on Coastal Structures
Waves have the potential to create a variety of loading conditions on coastal bridges and scouring effects on roadways. Due to the dynamic nature of waves, they may create both lateral and uplift forces on bridges spanning waters subject to coastal storms. Guidance from AASHTO’s (2008)
recommends avoiding wave forces on bridge decks by designing to an elevation with a vertical clearance of at least one foot above the 100-year design wave crest elevation whenever possible. Raising bridge structures above the design wave crest elevation can prevent large wave forces from impacting critical bridge components but must be evaluated considering the overall associated increase in bridge cost and risk tolerance.
Design Wave Crest Elevation
Bridges and roadway structures should be designed using a design wave crest elevation that will help determine the elevation of the bridge deck or roadway.
describes the detailed approach for calculating a design wave crest elevation.
- For a Level 1 analysis, waves can be assumed to be depth-limited and will break when their height is approximately 80 percent of the local water depth (including storm surge) as described in the Wave Breaking section, above. Depth-limited wave characteristics are also described in Chapter 4 (Waves).The elevation of the wave crests under depth-limited conditions can be approximated by adding 60 percent of the water depth to the design stillwater level, as shown in Equation 15-3:design wave crest elevation= (maxdesign storm surge SWL) + (0.6d)sEquation 15-3.(HEC-25)Where
- d= local water depth, including tides and storm surges
See Chapter 9 (Coastal Bridges) for more information about estimating wave crest elevations. - For Level 2 or 3 Analysis, design wave crest elevations are modeled using nearshore/oceanographic numerical models (refer toNumerical Modeling of Wavessubsection, below) that rely on local wind and water level conditions as inputs.If complete avoidance of wave loads is not feasible, the designer may choose to mitigate and/or accommodate the potential wave forces (refer to AASHTO Specifications, Sections 4.3 and 4.4). Selecting an appropriate level of analysis and design strategy to accommodate potential wave forces will depend on the importance/criticality of the bridge or roadway when considering the consequences of bridge and roadway damage caused by wave forces. For example, if a bridge is deemed “Extremely Critical,” it will generally be designed to resist wave forces with little to no damage to the bridge, so that the structure could be in service immediately following the storm event. If a bridge is deemed “Critical,” it will typically be designed to withstand the storm event but will likely require repairs to maintain service long-term. Bridges that are deemed “Non-Critical” will not require an evaluation of wave forces and may require major repairs or even replacement following a large storm event.Using AASHTO Specifications, Section 5.1, a bridge should be classified as extremely critical/critical as follows:
- Extremely Critical— Bridges that are required to be open to all traffic after the design event and be useable by emergency vehicles and for security, defense, economical, or secondary life safety purposes immediately after the design event. Bridges that are formally designated as critical for a defined local emergency plan.
- Critical— Bridges that should, as a minimum, be open to emergency vehicles for security, defense, or economical purposes after the design event and open to all traffic within days after that event. Bridges will likely be formally designated as critical for a defined local emergency plan.It is assumed that traffic will not be on bridges during the height of the storm, so the concept of immediate “life safety” is not an important consideration during design. Long bridges, in general, require a higher level of analysis than shorter bridges. It becomes more cost effective to consider a higher level of analysis as bridge length increases.Details regarding the determination of the level of importance of a proposed bridge, associated performance objectives of the bridge, and appropriate level of analysis are described in the AASHTO Specifications. Refer to Table 15 3 for examples of bridge types related to their appropriate level of analysis. In general, the following synthesis may be helpful for determining if a greater level of analysis is required.The following criteria will be required for consideration in the determinations (Florida Department of Transportation, 2009):
- Age and condition of existing bridge structure and the feasibility/cost of retrofitting to resist wave forces
- Proposed bridge location and elevation alternatives (elevation relative to the design wave crest)
- Estimated cost of elevating the structure above the wave crest clearance, and/or the justification of why it cannot be done
- Effect of varying wave loading on construction costs (due to location or height adjustments)
- Existing and projected traffic volumes
- Route impacts on local residents and businesses
- Availability and length of detours
- Evacuation/emergency response routes
- Duration/difficulty/cost of bridge damage repair or replacement
- Other safety and economic impacts due to the loss of the structure
In addition to coastal bridges, it is important to calculate wave forces on coastal armoring placed for protection of transportation assets. For guidance on calculating wave forces on vertical walls, concrete caps, convex and concave cornered structures, and submerged structures, see the USACE CEM (refer to Part VI, Chapter 5-4). Specific wave force calculations are complex and depend on factors that require inputs related both to the designed structure—shape, configuration, and elevation relative to the design water elevation—as well as the wave itself. These calculations, as defined in the USACE CEM, require defining not only wave magnitude in height and period, but the wave’s shape, which impacts how air pockets are trapped at the location of wave impact and the associated force upon the structure. Further discussion on the effects of waves on scour and scour protection design are discussed in Section 5. Given the importance and complexity of these considerations to the integrity of bridges and roadways, involving a precertified coastal engineer in the project’s design or review phases is highly recommended and should be considered requisite for projects expecting coastal waves exceeding 1.5 feet in height, in accordance with the current definition from FEMA designating that wave height as the Limit of Moderate Wave Action (LiMWA) in the coastal zone (FEMA, 2013). The LiMWA defines that waves of at least 1.5 feet in height are likely to cause structural damage upon impact.
Wave Generation on Lakes
Under the right set of conditions, wind can generate large or damaging waves on lakes. As discussed in the Wave Dynamics subsection, wave height is a function of fetch length, so that the longer (or larger) the lake, the higher the waves that may be generated. It is also important to note that even the persistent presence/effects of tiny waves may cause severe erosion on shorelines or embankments.
In fresh or brackish waters, establishing vegetation along the shoreline fronting low-lying coastal roadways can often provide effective erosion protection, similar to what is done for dunes facing the Gulf of Mexico shoreline. When considering vegetation as an erosion prevention measure, designers should not overlook the possibility of erosion occurring before the vegetation becomes established. Light armoring, such as rubble or geotextile fabric, should be applied in addition to vegetation during the transitional period.
Ship Wakes
Ship wakes may be the largest waves to occur in sheltered locations, such as Intracoastal Waterways, and can be applied to represent the design waves in equations used in designing coastal protection armoring or other transportation assets, including designs for TxDOT operated ferry facilities. The magnitude of the wake depends on the vessel size, hull shape, speed of vessel, and distance from shoreline. Large ships can generate wakes with wave heights exceeding 10 feet, while smaller vessels, such as tugboats and barges, may generate wakes with wave heights of around 5 feet. The maximum size and speeds of all possible vessels should be considered in the engineering design. The following studies present approaches for estimating ship wakes:
Large Vessels
- Weggel, J.R. and Sorensen, R.M., 1986. Ship Wake Prediction for Port and Channel Design. Proceedings from the Ports 1986 Conference. American Society of Civil Engineers. P. 794-814.
- Kriebel, D.L., Seelig, W., and Judge, C., 2003. A Unified Description of Ship-Generated Waves. Proceedings of the PIANC Passing Vessel Workshop. Portland, Oregon.
Small, Recreational Watercraft
- Bottin, R.R. Jr., McCormick, J.W., and Chasten, M.A., 1993. Maryland Guidebook for Marina Owners and Operators of Alternatives Available for the Protection of Small Craft Against Vessel-Generated Waves. Prepared for the Maryland Department of Natural Resources. Coastal Engineering Research Center. Vicksburg, Mississippi. 92pp.
Numerical Modeling of Waves
Where local wave data are not available or when it is necessary to capture the dynamics of a complex shoreline or large-scale project, numerical simulation of wave conditions may provide higher confidence in the selection of a design wave crest elevation. Numerical models account for site specific details and processes that give rise to complex interactions between water and the surrounding natural and built environments. Using numerical models reduces the uncertainty associated with representing relevant coastal processes needed for designing roads and bridges.
Table 15-3 provides general direction on selecting the level of analysis and potential models that may be applicable for each case.
Wave Data Sources
- NOAA National Data Buoy Center (NDBC)— The NDBC provides several offshore oceanographic stations that record wave data, including significant wave heights, in the Gulf of Mexico.
- USACE Wave Information Studies— WIS is a series of multi-decade wind and wave hindcasts along the U.S. coastlines. The long-term nature of this data provides coastal engineers with information to perform statistical calculations and a better understanding of local conditions.
- FEMA Flood Insurance Studies— Some FEMA FISs contain wave height estimates considered in flood hazard mapping analyses. However, the FIS may include a wave height statistic rather than the significant wave height, which is commonly used in design. FEMA FIRMs and FIS data are applicable for a Level 1 analysis or to determine the exposure of infrastructure to coastal flooding. They are not recommended for Level 2 or Level 3 designs.