Storm Tides
Tropical and extratropical cyclones can be hazardous for projects located in coastal areas both along the shoreline and several miles inland. Storm tides, which represent the stillwater elevation inclusive of storm surge, can bring high water, strong currents, and large waves to locations that are not normally exposed to coastal forces. Storm tides are difficult to predict, as it is highly sensitive to small changes in storm track, size, approach speed and angle, and atmospheric pressure. Characteristics of the coastline, including the width and slope of the offshore continental shelf and the presence of inlets, such as bays and estuaries, also affect the elevation of a storm tide.
To account for the water elevations associated with storms during the infrastructure planning and design phase, storm surge is added to the astronomical tide (typically represented by the normal high tide) to derive a storm tide elevation (Figure 15-8). Storm tides are stillwater elevations, meaning they do not include wave effects, such as wave amplitude and wave setup. Storm tides are often expressed in terms of an exceedance probability, or the likelihood that the water level will surpass a given elevation based on a statistical analysis of historical observations or model simulations.
For example, a 100 year flood event identifies a stillwater elevation that has a 1% annual exceedance probability (AEP). It is commonly used as an indicator to inform assessments of flood risk or design criteria (FHWA, 2005). Refer to Chapter 4 (Hydrology), Section 2 (Probability of Exceedance) for commonly used terminology regarding exceedance probabilities. In this section, it is also referred to as a return period or return interval. For planning and design phases, care should be taken in understanding how the storm tide elevation was computed, based on the type of approach, modeling methodology, and models adopted, as it could include or not include wave setup and/or tides.
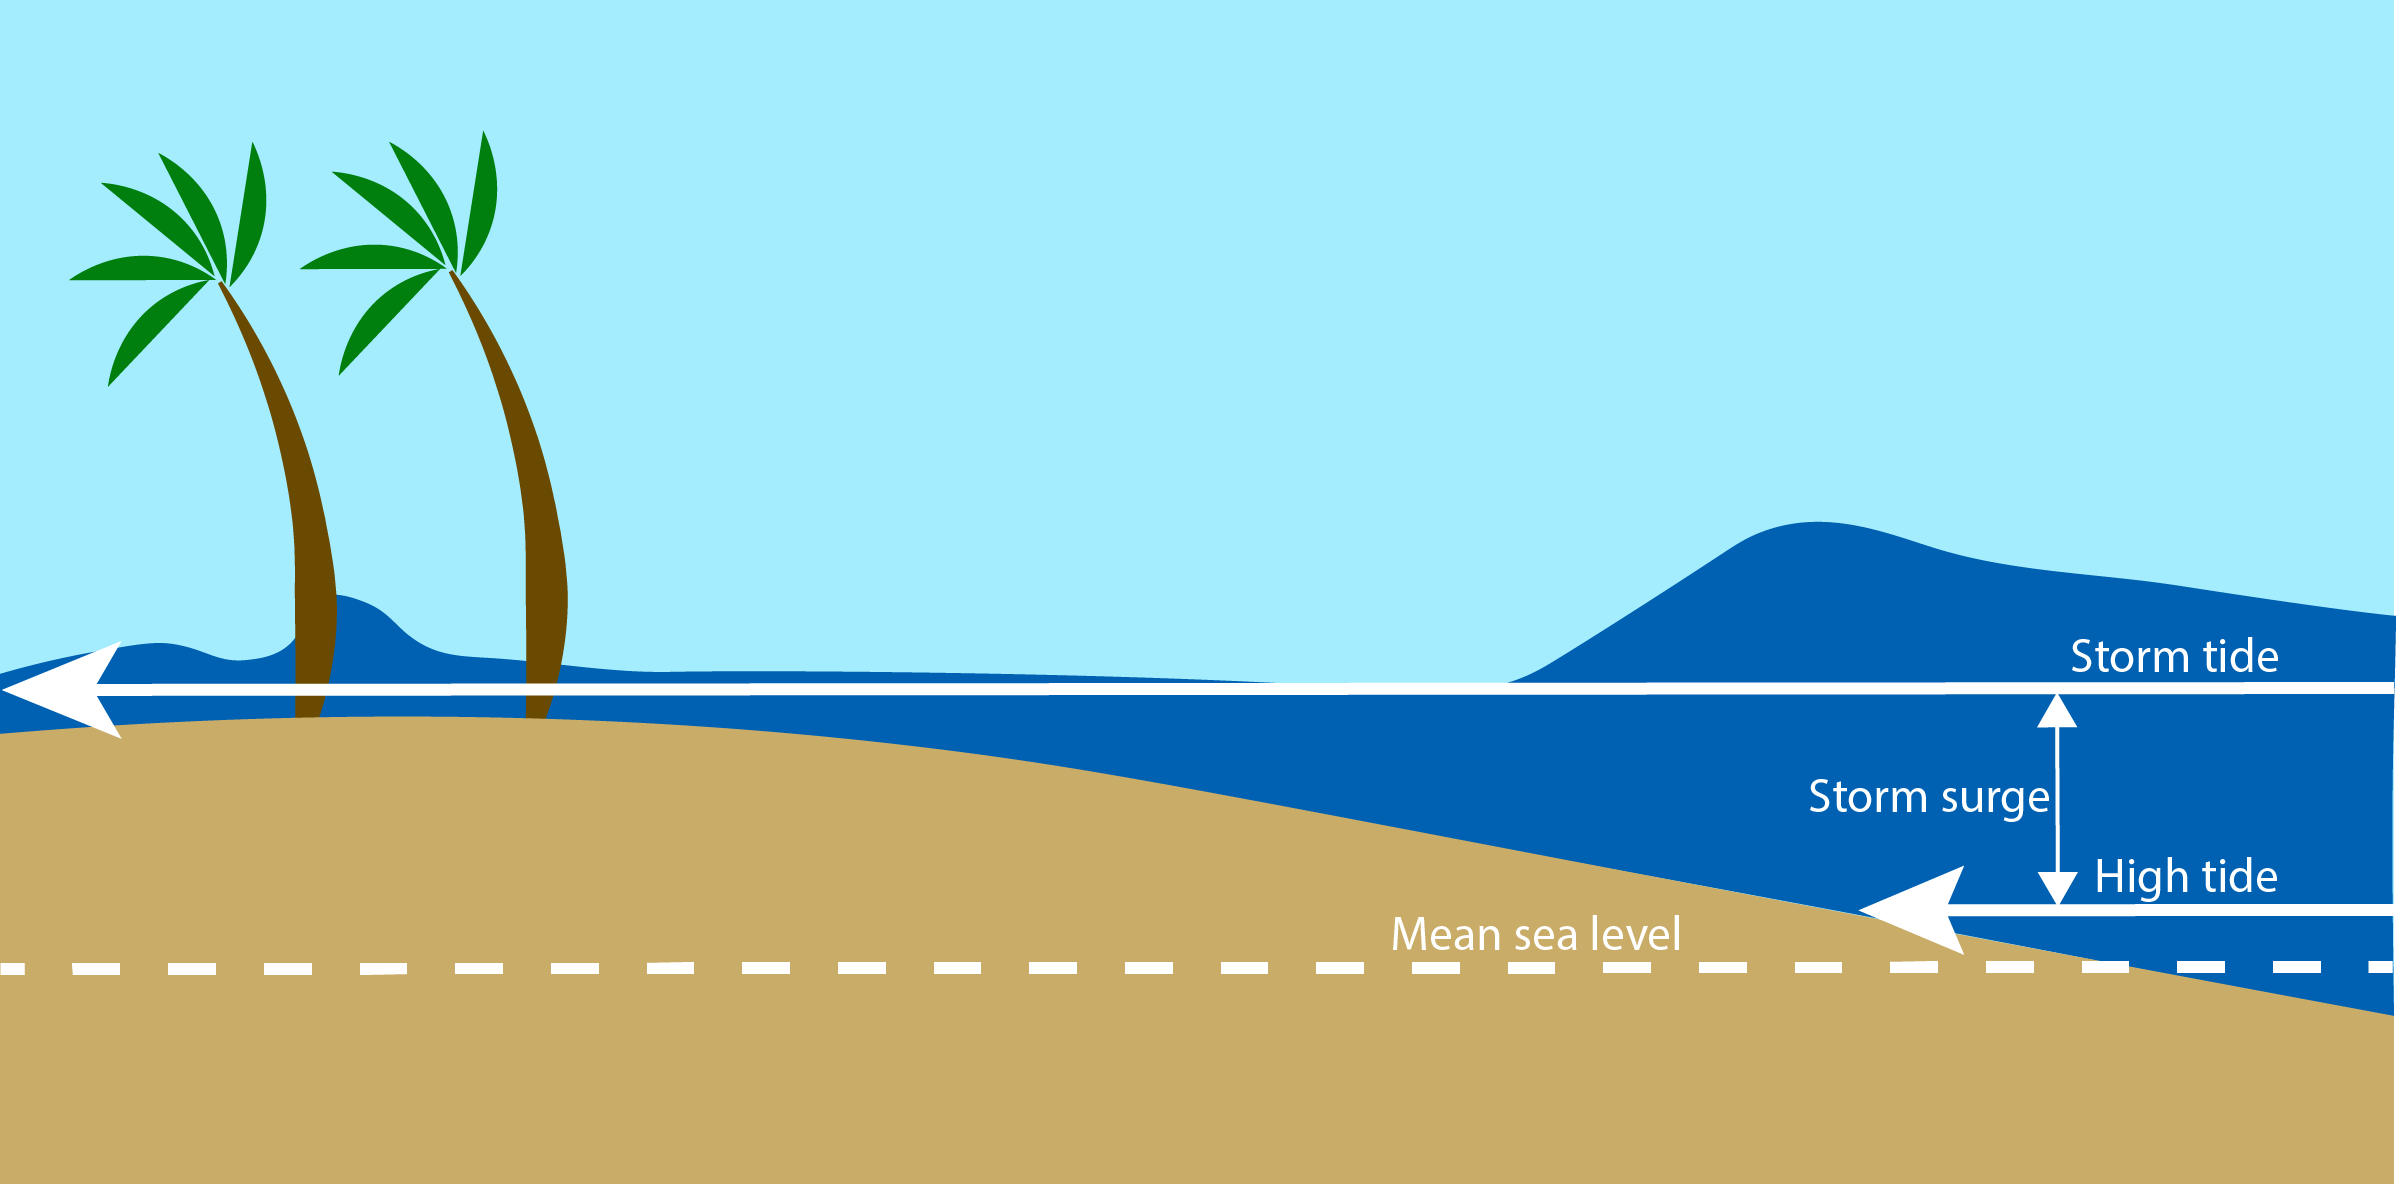
Figure 15-8. Storm Surge vs. Storm Tide (modified from NOAA Storm Surge Overview,
)
Storm tides are an important consideration for transportation infrastructure located in the coastal environment because these events allow waves to reach farther inland, thus exposing areas at higher elevations to the risk of flooding and wave action. It can also influence the hydrodynamics along tidal inlets, increasing risk of scour around bridges and coastal structures.
Storm Tide Sources
The following list describes readily-available storm tide information that may be applicable for project design. The approach to derive storm tides varies in terms of the numerical equations used, assumed boundary conditions, quality of topographic and bathymetric data, and selection of statistical models used to estimate return intervals. Therefore, it is no surprise that the results between studies are likely to differ from each other, in some cases, significantly.
The storm tide sources described below, while useful for understanding relative extreme water elevations during storm events, will require review by a TxDOT Precertified Coastal Engineer as they may not be adequate for design of site-specific projects. For a Level 1 or 2 analysis, the designer may be able to obtain appropriate storm tide elevations from the sources listed below. These storm tide sources may also be applicable for a Level 3 analysis for initial project evaluation. Otherwise, numerical modeling (refer to the
Numerical Modeling of Water Elevations
subsection) may be required to calculate local storm tide conditions. FEMA flood insurance study data can also be useful for storm tide data, but the base flood elevation data they provide includes additional coastal factors such as wave and run-up data. Additional interpretation of this data would be necessary to determine stillwater levels.- U.S. Army Corps of Engineers (USACE)— The USACE Galveston District is responsible for public navigation and engineering projects along the entire Texas coast. Prior USACE projects may have developed stillwater levels that could be used for transportation infrastructure design. For transportation projects planned near areas where USACE structures are located, it is recommended that the USACE District be contacted to inquire about any previous water level analyses that may have been performed for the area. Results will likely have been developed based on specific past project needs and should be carefully evaluated prior to use, but may be applicable for project design, particularly for a Level 1 analysis.
- NOAA Extreme Water Levels— NOAA publishes storm tide estimates based on statistical analysis of historical tide data. Published values are often consistent with the stillwater level component of the FEMA base flood elevation. For NOAA-operated tide stations along the Texas coast, annual exceedance probability levels have been calculated for the 1-, 10-, 50, and 99-percent annual chance storm tides.
Extreme Storm History
In addition to obtaining numerical water level data, understanding the history of extreme storms and associated impacts at a project location is important for design. Although it is a qualitative assessment, reviewing prior storm history can provide valuable insight for project design based on observations of local impacts posed by past significant events.
For all analysis Levels, it is recommended that the local storm history be reviewed to consider local storm impacts. For Level 1, it may be reasonable to simply reference and compare high water marks or other recorded data to published flood frequency elevations. In particular, the designer should consider large storms that occurred after the FEMA maps were published. For example, Hurricane Harvey occurred in 2017. If the FEMA maps for the project area are dated 2010, then clearly the effects of Harvey potentially influencing the 100-year flood level estimates were not included. While a complete re-analysis may not be feasible for a given transportation project, multiple high stormwater events or even one very large storm after the FEMA elevations were published could indicate that the FEMA levels are underrepresenting the risk. Further consideration may be warranted and may elevate what was planned to be a Level 1 analysis into Level 2 or Level 2 to Level 3 analysis. For Levels 2 and 3, a more in-depth investigation of historical storm effects should be performed.
- NOAA Historical Hurricane Tracks — NOAA documents historical tropical system tracks based on user input. Options for input include location and radius of interest, timeframe, ocean basin, category, among others. The database includes hurricanes, tropical storms, tropical depressions, and extra-tropical storms.
- NOAA Storm Events Database — NOAA maintains a database of recorded tropical and extra-tropical systems that can be searched by location, storm strength, and other factors.
- Hurricane Reports — NOAA, USACE, the University of Texas–Bureau of Economic Geology, the Texas A&M University–Corpus Christi Harte Research Institute, and other public research institutes have published reports documenting the strength and impacts of many of the historical hurricanes that have impacted the Texas Gulf Coast. These reports can generally be obtained online and/or from library archives.
- Sea, Lake, and Overland Surges from Hurricanes (SLOSH) Model — NOAA’s database compiles the results of the SLOSH numerical model developed by the National Weather Service. The SLOSH model provides estimates of storm surge heights for historical, hypothetical, and predicted hurricanes by modeling different storm tracks, approach angles and speeds, hurricane categories, and tide levels. Risk-based information (e.g., exceedance probability) and specific flood elevations are not provided, and location-specific storm surge elevations are provided as a function of storm intensity (e.g., Category 1, Category 2, etc.). The database can be viewed using the SLOSH Display Program (SDP). .
- The SDP is intended for use by emergency managers to understand anticipated storm surge vulnerability. The results presented in the SDP can be used to understand worst possible surge levels. Although SLOSH model results are not likely to be used in roadway project design, they can be useful in the planning phase when assessing if the project site is vulnerable to hurricane storm surge exposure. SLOSH model results should be evaluated at each level of analysis for projects located in coastal areas to ascertain the risk from storm surge based on project location. If SLOSH results indicate that the site is exposed, it is recommended that additional freeboard or armoring be incorporated into the project design, particularly if it is a Level 2 or Level 3 analysis.